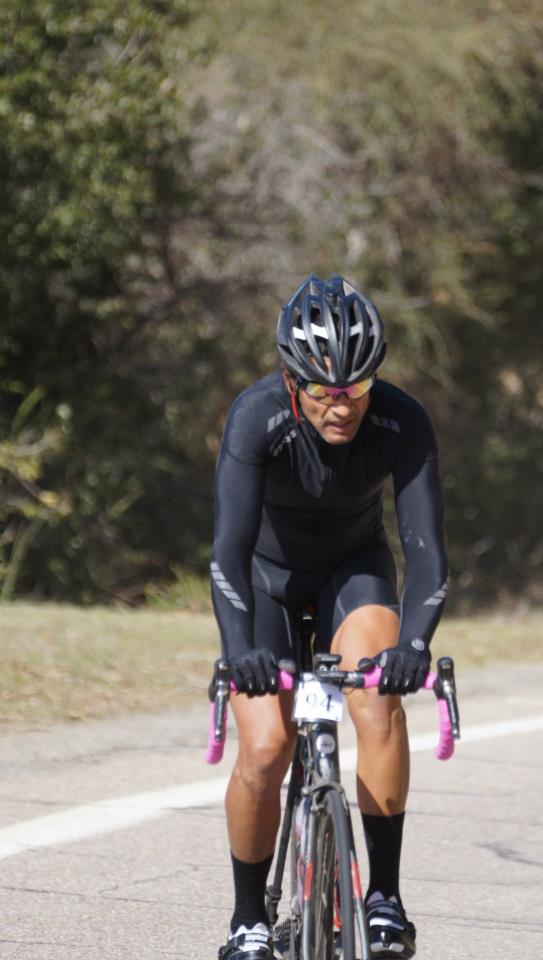
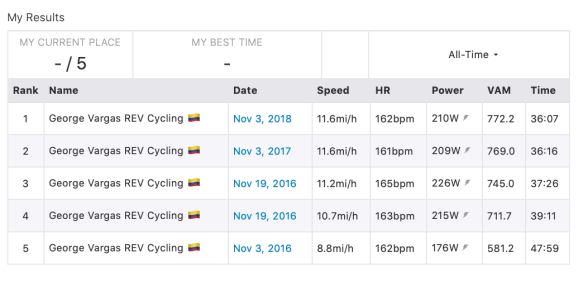
On November 3, 2018, George Vargas participated in the Mike Nosco Memorial ride, 10th Anniversary edition. With increased focus throughout the year on diet and weight loss he was able to attain new Personal Records (PR) on two of the three timed climbs. The three timed climbs were: Deer Creek Rd, Mulholland Highway, and Latigo Canyon. The weather was excellent, albeit a little warm towards the end.

Left to right: George Vargas, Jack Nosco and Lori Hoechlin
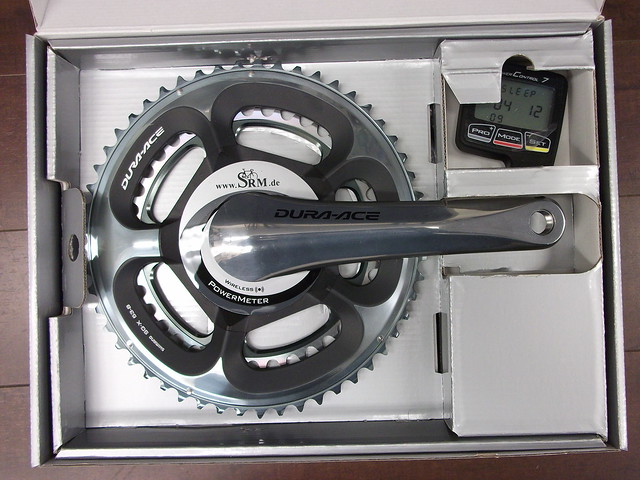
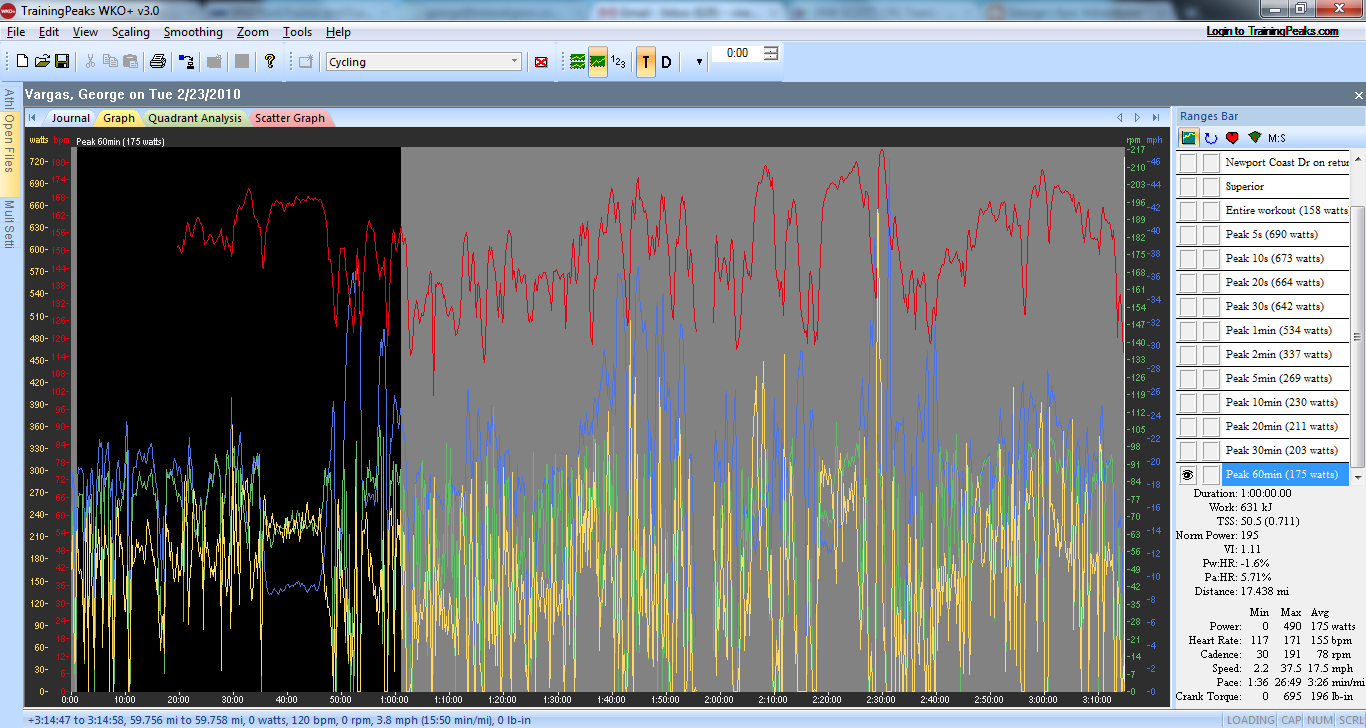
I wish to share with you my excitement of having a great day on the bike. Since I am a nobody, really, I will share my power data with you. Some of my posts are about the ride and the sights and sounds and the struggles of completing endurance events. This post will be more about data. Don’t tune out because it won’t be THAT heavy, or maybe it will, but it is important for me to show a few examples of why training and racing with a power meter is essential.
First things first, I wish to thank Jack Nosco for creating and putting on this great event every year on November 3rd. In Jack’s words,
“As I work to preserve my brother’s memory through the Michael P. Nosco Foundation, Inc., my main goal is to provide financial relief to families and/or individuals in our community. The emotional support that comes with 700+ people showing up in their honor is incredible! Your support means a lot to them and goes a long way in providing inspiration and strength to our recipients and their families.”
Each year the foundation will provide financial relief to a handful of recipients. You can read about this year’s recipients here. If you are ever free on November 3rd please consider making a donation and riding this great ride for a great cause. It is held every November 3 regardless of what day of the week it falls on since that is the date of Mike’s untimely death.
The Ride
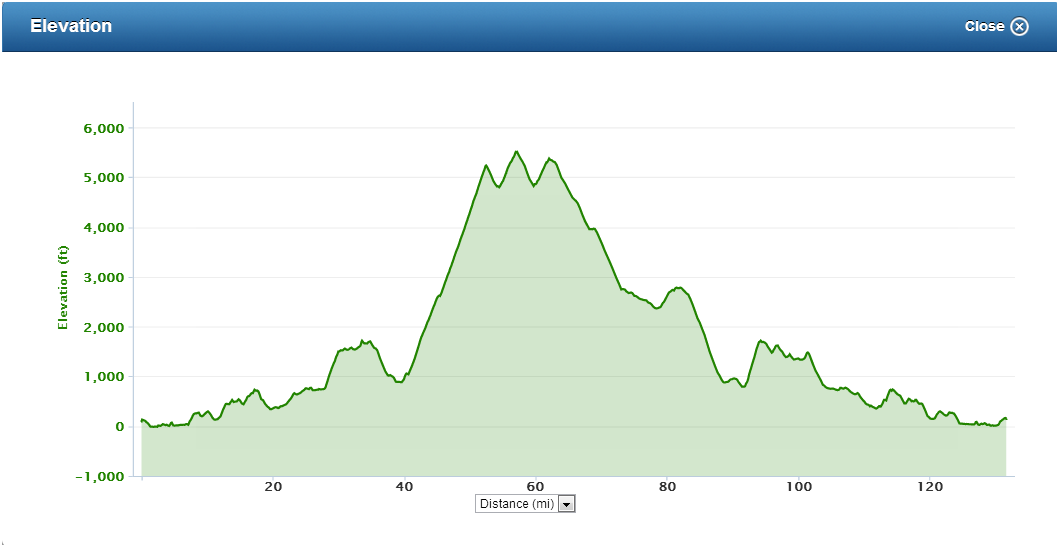
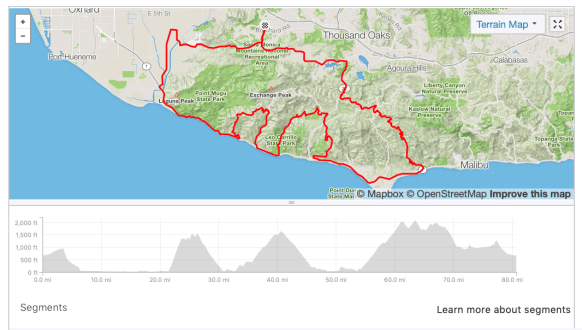
The course is 80 miles with about 8,000 feet of climbing. You will climb three defined climbs but there are plenty of rollers and steep-ass kickers throughout the course. The featured climbs are Deer Creek Rd, Mulholland Hwy and Latigo Canyon. Each of the climbs are distinctive and offer their own unique challenges.

The Climbs
Climb #1
Deer Creek Rd — the steepest climb of the three is also the shortest of the three, at 2.25 miles. It averages 11% but the ramps, oh my the ramps are over 15%+. Every year I see so many riders hit the bottom of Deer Creek, which has to be over 17%, so hard that within minutes they are pedaling squares and barely moving forward and upward. More on that later… In previous years, my enthusiasm has also gotten me into trouble before the base of this climb. I have tried to stay in the pack that leaves the memorial site and then hammers towards the coast and then south on the coast to the bottom of the Deer Creek. This year I told myself I would not do that and just let the pack/s go. The reality is I would just get in the way of faster riders if I was up near the front when hitting the base of the climb. Besides, I don’t have a snowball’s chance in hell to place in the top 3 riders of the day. I am only racing against myself using my power meter as my training/racing partner.
A little more on the riders that blow up because they have gone too hard at the bottom of the Deer Creek. They quite literally are going so slow and weaving so much they block the path of riders coming up behind them. At least if they were doing the “paperboy” up the climb that would be better. As a rider coming up behind one of them you can at least see a pattern to the weaving but most are not weaving in any discernible way. My suggestion to them is next year bring a larger range cassette. I had an 11-28 with a 53/39 crankset. My cadence is slower this climb than what it is normally but it’s only 2.25 miles and I don’t see a need for a larger cassette than 11-28. I would also suggest they stay to the right of the road and within their lane since the roads are not closed to vehicular traffic. Every year I see riders crossing over the centerline which is a definite no-no and very unsafe. Additionally, as faster riders come from behind they need to get by the slower riders on their left and THEY also need to stay inside the centerline. Years past I have seen rear derailleur hangers snap right in front of me. I have seen many chains drop as well. This is probably the most common rider mishap I see on this climb. Last year or the year before a rider dropped the chain to the inside and it got past the chain catcher all the way to the frame. The chain was then lodged behind the chain catcher which was attached to the front derailleur by 2 mm or 2.5 mm fastener. You will be hard-pressed to find a multi-tool with that small of an Allen wrench on it. Most multi-tools a 4 mm is usually the smallest Allen head found on a multi-tool. This poor rider was dead in the water until a SAG vehicle could come up with a full set of tools to help them get the chain catcher out of the way, get the chain out, and then re-adjust the chain catcher. Personally, I don’t use a chain catcher for that very reason. I don’t have one installed on any of my high-end bikes. A properly tuned bicycle shouldn’t need a chain catcher or a dork-disc on the rear wheel. Just my two cents…

I had a PR on the Deer Creek climb of 21:38 my previous best was 23:16. I have heard somewhere before that 1,000 VAM is the minimum for elite climbers. As you can see I didn’t achieve that in 2016 with only 833 VAM. I doubt I could hold 1,000 for an hour lol!

As I mentioned in my introduction I have been focused on weight loss this year. I have mentioned in previous posts that I have been using Intermittent Fasting (IF) and a diet that is low in carbohydrates and higher in fats and protein. Basically, I have a reason to eat all the yummy healthy fats now such as Avocado, Olive Oil, Coconut Oil and much more 🙂
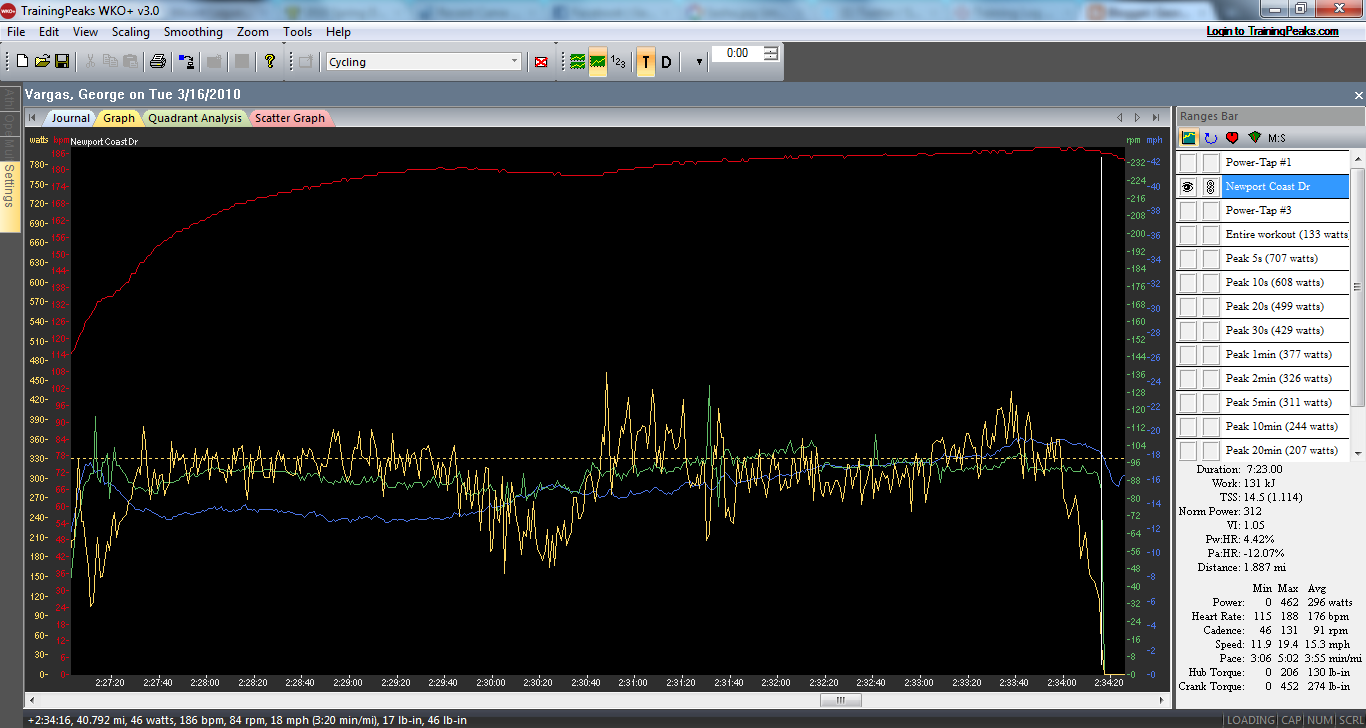
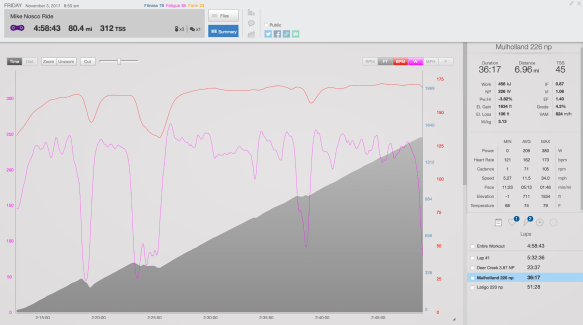
I digress, this year I was 63.57 kg or 140 lbs that’s down a few pounds from last year. You will note the Strava numbers show me averaging more watts for the Deer Creek climb in 2018 than 2017, 257 w and 254 w, respectively. The numbers are actually flip-flopped when you look at my Training Peaks data below.
Normalized Power (NP): 258w for 2018 and 259w for 2017. But remember the weight loss? I was a few pounds lighter this year so even though my NP was 1 watt lower this year than in 2017 I was actually 1:52 faster for the same wattage with an increased power to weigh ratio or watts per kg or w/kg.
w/kg 4.06/kg 2018 vs 3.87 w/kg in 2017
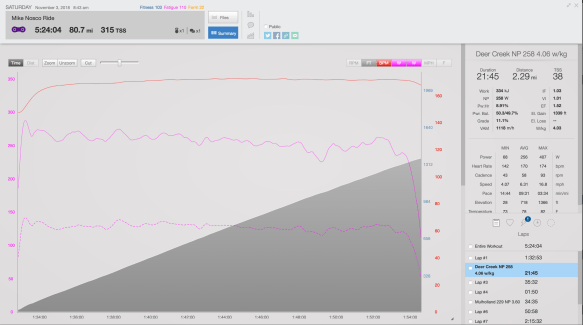
2018
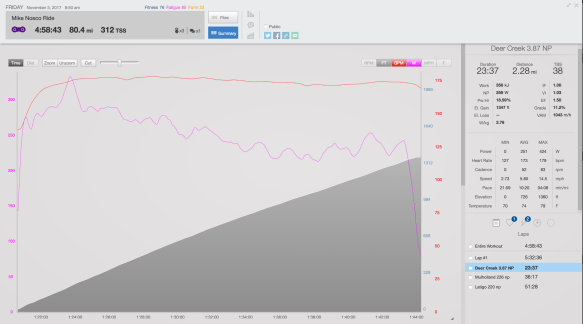
2017
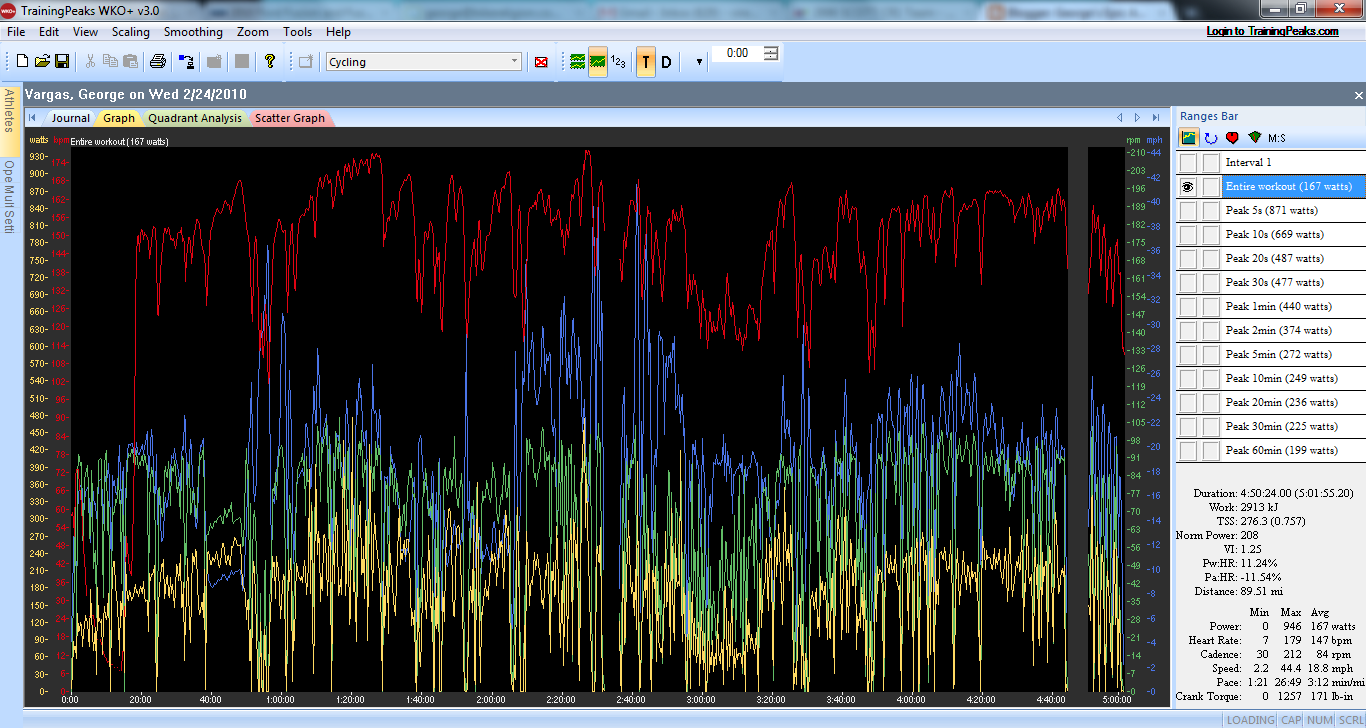
Regarding 2017 – notice how there is a big spike in power (pink line) at the base of Deer Creek and a slow degradation of power throughout the entire climb. I took a look at the 2017 climb at split it into thirds. My power was: 1/3 291w NP, 2/3 253w NP, 3/3 229w NP — that is poor pacing on the climb.
2017 NP for the 23:37 was 259w
1/3 over by 32 watts
2/3 under by 6 watts
3/3 under by 30 watts
Now let’s look at 2018 – 1/3 268w NP, 2/3 259w NP, 3/3 248w NP
2018 NP for the 21:45 was 258w
1/3 over by 10 watts
2/3 over by 1 watts – negligible really
3/3 under by 10 watts
I paced myself much better in 2018 and felt better because of it when I hit the summit.
Climb #2
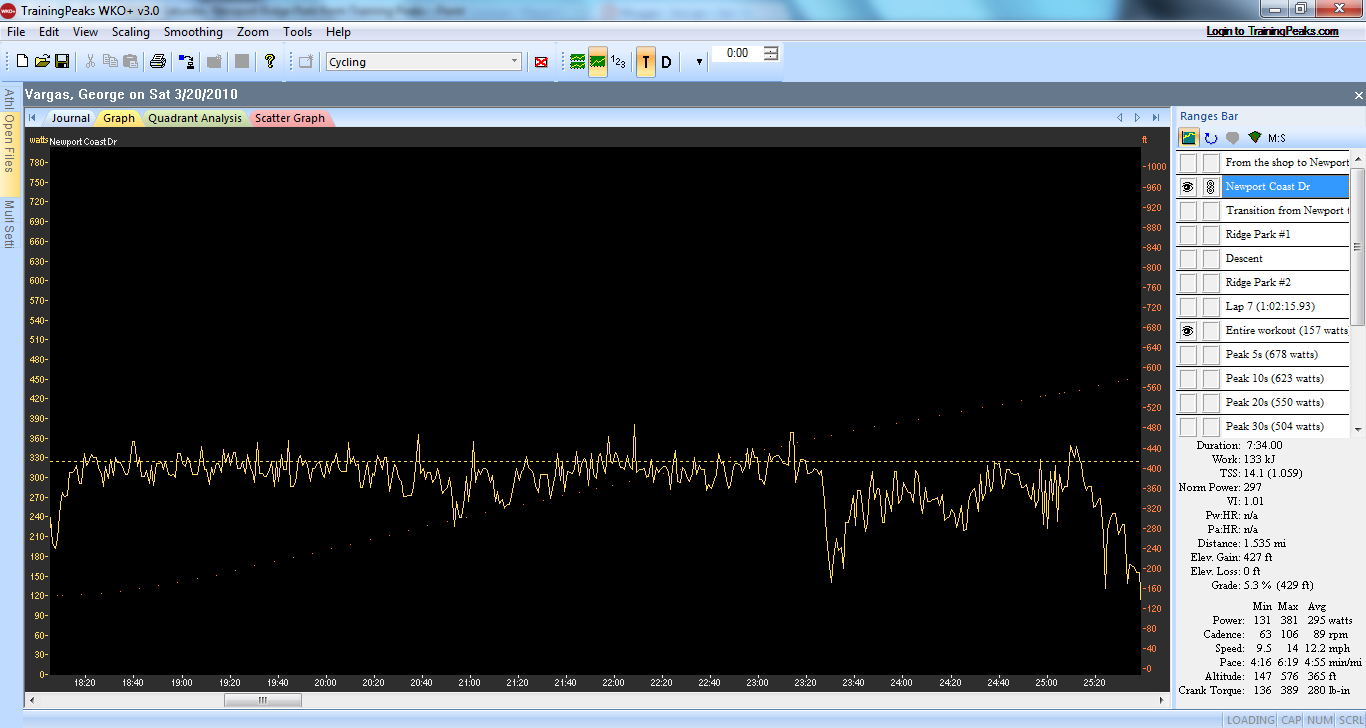
Mulholland Hwy – 6.9 miles stair step climb with a few dips along the way up with no memorable ramps – memorable as in steep. The dips lower the overall average grade down to 4% but the climbing portions are all within the 6-8% grade.
I increased my NP from 226w (2017) to 229w (2018). But more importantly I increased my w/kg from 3.38 w/kg (2017) to 3.60 w/kg (2018) my time improved from 36:17 in 2017 to 35:25 in 2018 — a 52 second improvement


2018
2017
Climb #3
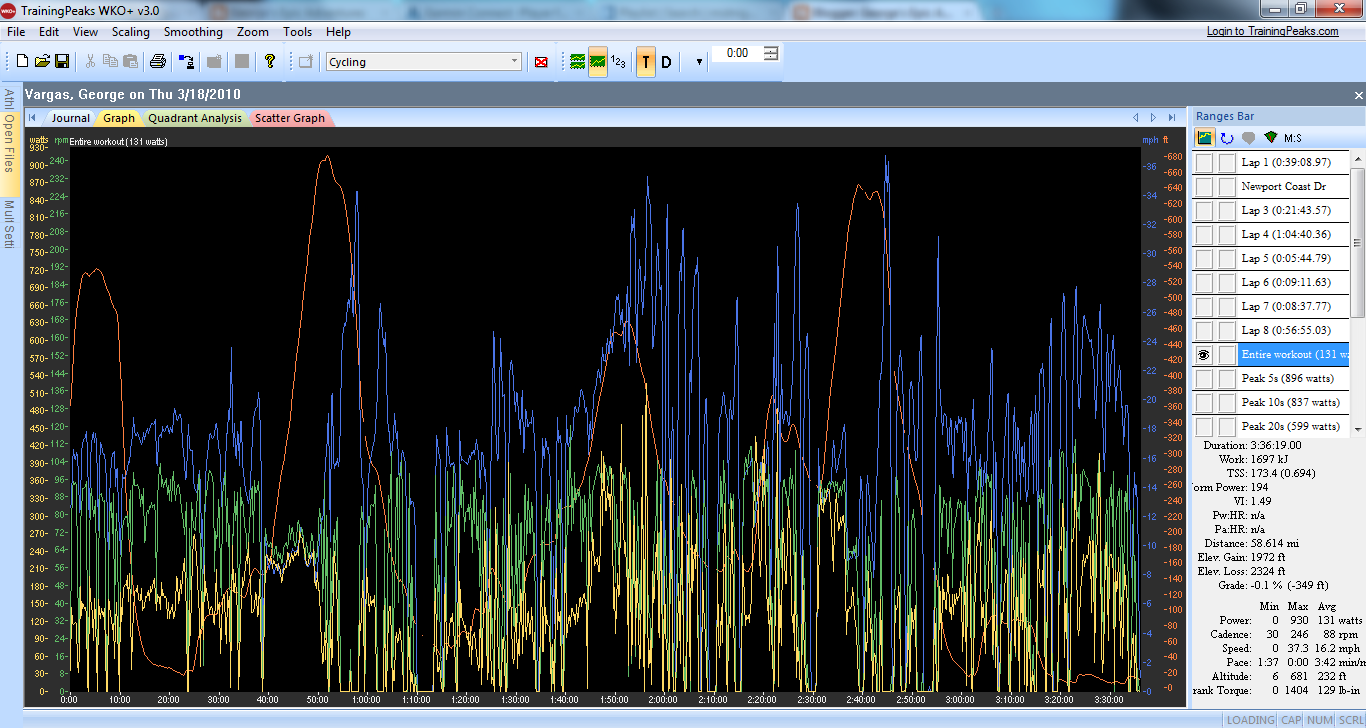
Latigo Canyon — another stair step style climb with dips on the way to the top of the 9.2 miles gaining nearly 2,000 feet. I was 1:37 slower in 2018 than in 2017 (PR). I remember last year being with a group of stronger riders like Rahsaan Bahati and Neil Shirley. They set a good tempo for them reflecting by their ability to still chit chat. I, on the other hand, had to ride outside my comfort zone just to stay in contact. I feel I could have gone just a little harder in 2018 but I was alone with no wheels to stay on or chase up the climb. Everyone was so spread out that I just used my power meter to get up the climb. I did pass riders along the way but it would have been nice to work with a few riders that were stronger than me to see what else might have been possible.
1 minute 37 seconds…. 97 seconds… 9.2 miles … just 10 seconds faster per mile would have done the trick right? I was also riding “blind”. In other words, I didn’t have a clue what my PR was and how to pace to it. Who knows I might have had some fatigue from having PR’d the two previous climbs. Either way I still feel good about my effort.


2017 remains my PR on Latigo Canyon
POWER PROFILE CHART
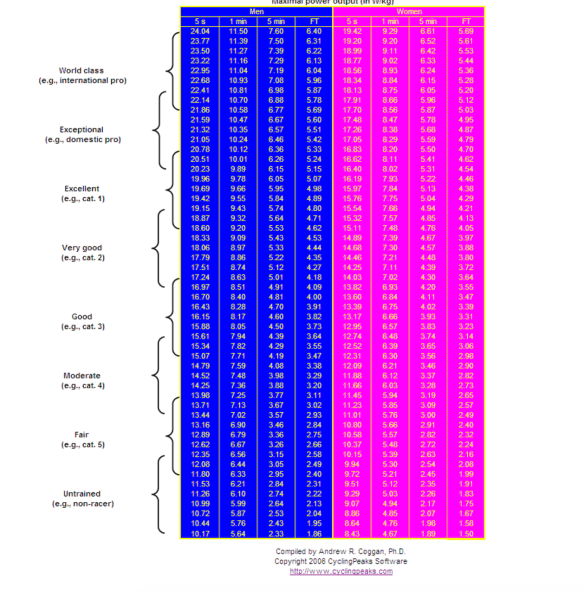
Let’s put this data in context. Below you will find the Power Profile Chart. Earlier, I said I am really just a nobody, a hack, just a guy trying to do my best at endurance events and climbing events such as the Mike Nosco Ride. I do these events for the personal challenge. I foolishly seek gains even as I get older every year lol! When looking at the Power Profile Chart you will see four columns. The column headings are duration in time. On the left side you will see ranges for each of the categories of cyclists. To use the chart you select either 5 seconds, 1 minute, 5 minute or FTP (60 mins) of time and then find your watts per kilogram. So for example, it is said that the power you hold for 20 minutes is closely related to your 60 min power. It is supposed to be about 5% higher than the power you can hold for 60 minutes. In my coaching practice, I tend to use 10% instead.
Let’s use my numbers,
259 watts for 20 minutes translates to 233 watts for 60 minutes.
233 watts divided by 63.57 kg = 3.66 w/kg under the FT column you look for 3.66 w/kg and it falls in the low Cat 3 high Cat 4.
For an endurance cyclist you would think my FT (60 min) power would much higher wouldn’t you? So would I. Maybe I should be doing shorter events right? Lately, my focus has been on getting my 1 and 5 minute power higher through my Wednesday night shop ride, The REV NIGHTER!
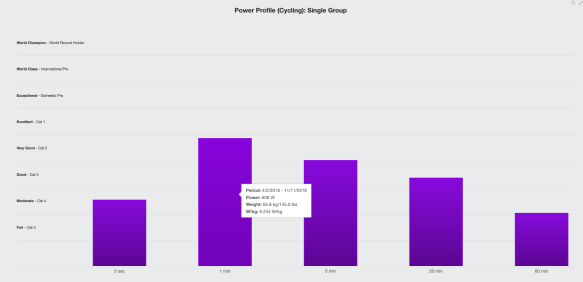
Attached are screenshots of my 1 minute power 9.24 w/kg and 5 minute power 5.0 w/kg
1 minute power 9.2 w/kg is straddling the high end of Cat 2 and the low end of Cat 1
5 minute power 5.0 w/kg is straddling the high end of Cat 3 and the low end of Cat 2
Now just for fun look at what a world class athlete holds for FTP — 6 w/kg for 60 minutes!! That would be me holding 380 watts for 60 minutes … um … no! 4-5 minutes tops lol!

SUMMARY
When all is said and done, I had a great day on the bike. I PR’d 2 out 3 climbs. I was close on the third climb. I never felt like I was going to blow up. I feel like I chose the right intensity and power, to start and finish the climb at the same intensity. Maybe I could have gone harder here and there but I am happy with my results. During the climbs I felt I was right on the edge of just about to go too hard. On the last climbs of the day – off the clock now – I still felt strong. Who knows maybe I still had too much in me and I didn’t leave enough out on the timed climbs. Being an endurance cyclist, an Ultra Cyclist, I am always saving some for the rest of the ride. This ride was only 80 miles – not 100 or 200 or even 500 like my typical races. Maybe I need to work more on that self-preservation instinct and leave it all out there.
I am hopeful to improve my times again next year. I don’t think I can lose any more weight and still maintain the same power output. So that means more interval training … ugh! At times, I am thinking the marginal gains I have made over the years will lessen going forward.
The weather was fantastic. No one crashed near me which has happened in the two previous years. Only one SUV buzzed me too close for comfort. I just don’t understand why motorists are in such a hurry when they see hundreds of cyclists on a twisty 9 mile climb they really aren’t going to get anywhere that much faster.
I hope to see you next year in attendance. November 3 will fall on a Sunday next year see you there.
What’s next?
If the week goes well I am planning another Everest for November 10. It is the Marine Corps Birthday. I am a former US Marine and wish to honor not only the Corps but veterans that suffer from PTSD. I also wish to meditate about my fallen comrades who die at their own hands by committing suicide.
Lastly, if you have questions about power meters or power meter coaching feel free to drop me a line at revcycling@gmail.com or you can make comments on this post. I am currently accepting a limited number of applicants for coaching. Let me know how I may assist you.