Three Month Base Building Numbers


Follow me on Facebook

Follow me on Twitter

Follow me on Strava

Follow me on SPOT

Here are some graphs of my training over the last three months.  These are the highlights.  All data collected on Training Peaks WKO+ v3.0

1.  I hit 1000 miles for the month of January.  First time over 1K since May of last year

2.  Notice the steady increase of miles and hours trained per month beginning in November 539 miles/35:24,  December 896 miles/56:45 and finally January 1002 miles/61:10

3.  Notice weight loss from 163 lbs down to 149.8 post ride today 2/1/13

4.  I train by hours but miles is easier for most people to understand and grasp so I am using mileage charts.  There is quite a bit of power data I can discuss as well.

5.  Notice 5 min peak power was 324 watts Normalized Power of  343 watts or 5 watts per kilo today.  Even with the weight loss this is the highest 5 minute peak power in the last 12 months!  It confirms that I have not lost power or muscle mass during the weight loss.

 6.  The last week of January was a recovery week and you can see the Acute Training Load line (PINK) and the Training Stress Balance Line (YELLOW) are just about to meet.  This translates to a feeling of being fit and well recovered.  Now it’s time to build for another three weeks.

If you have any questions please make a comment on the blog and I will get back to you!

Week in Review December 5 – Dec 11, 2011


Week Four of Base Miles (Recovery Week)

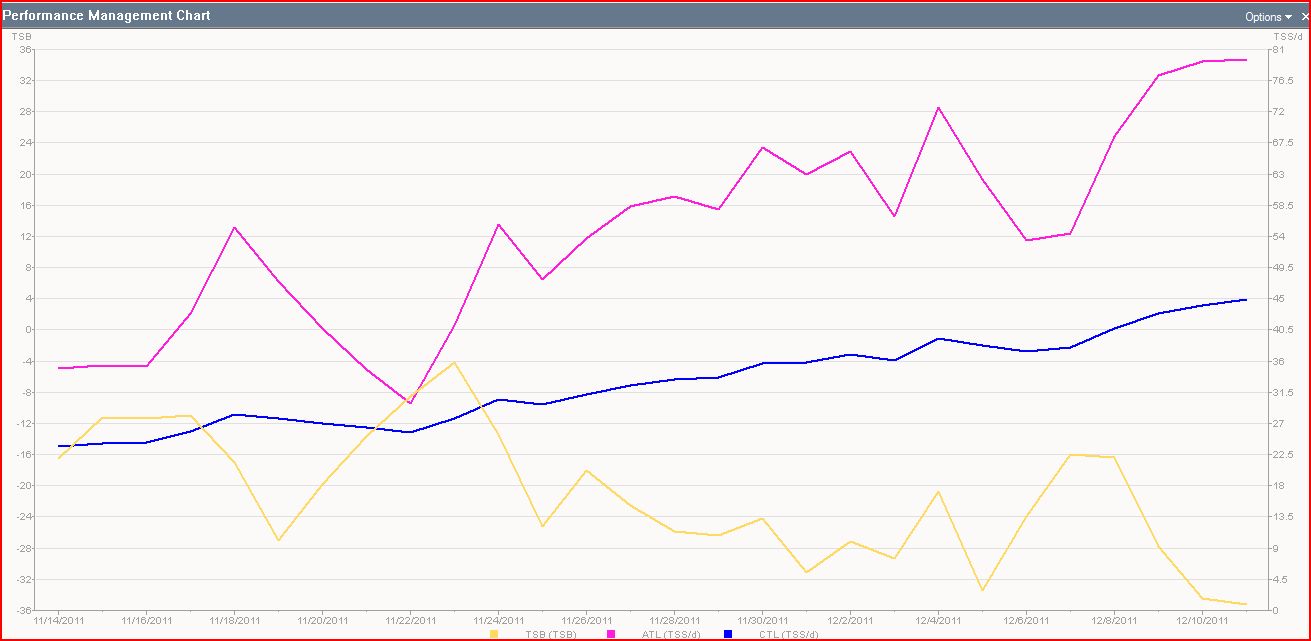
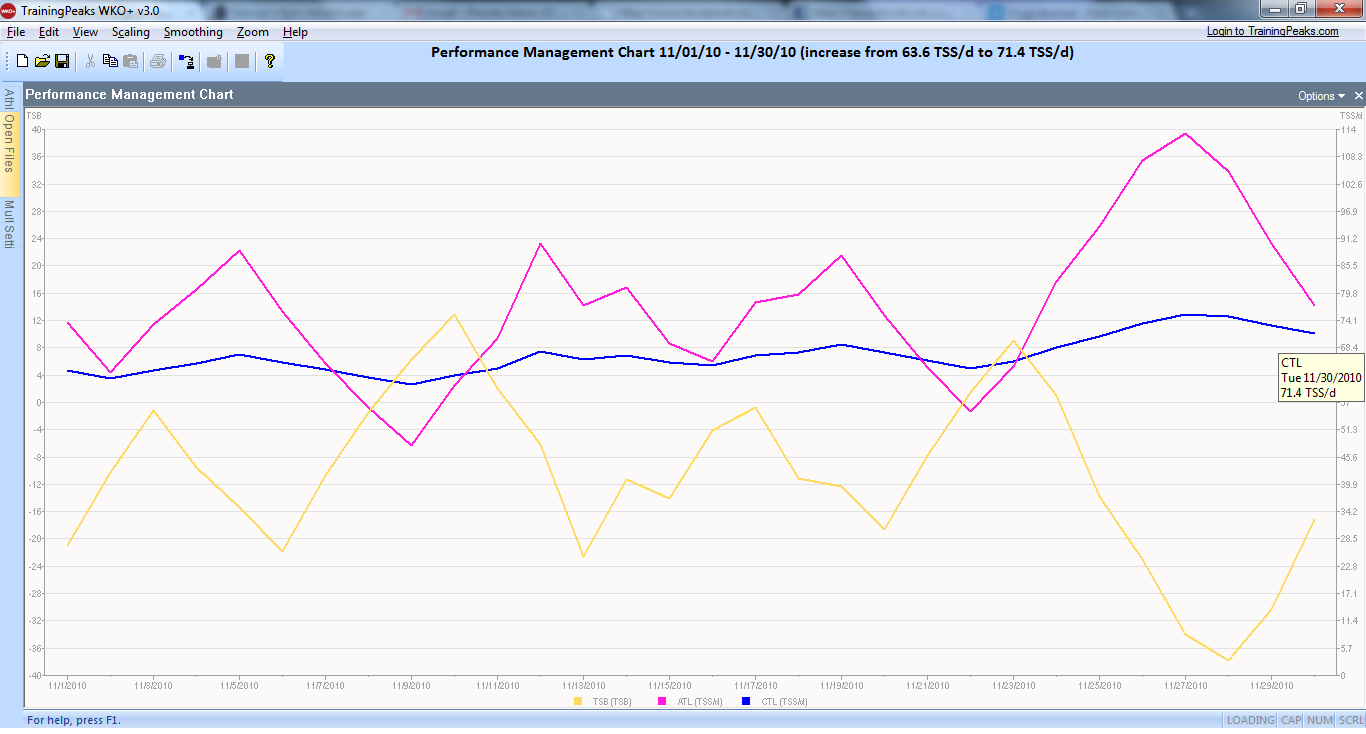
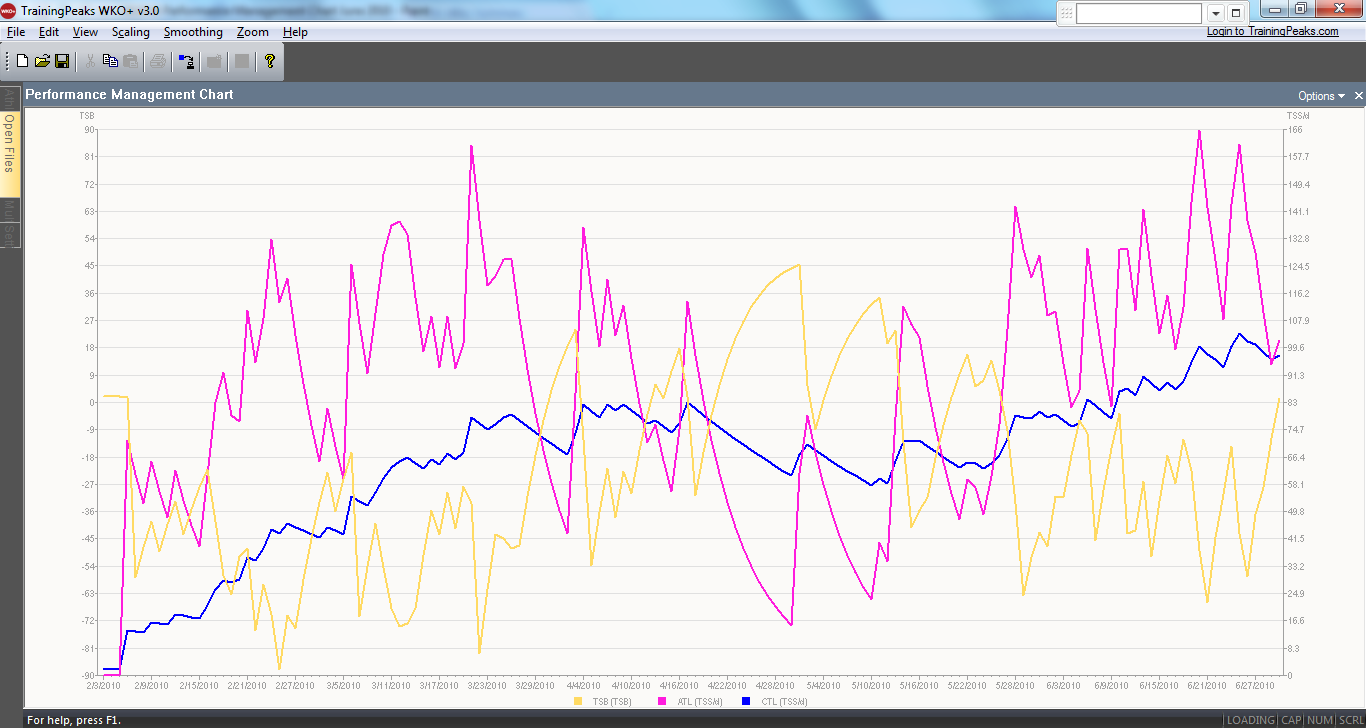
Performance Management Chart last 28 days

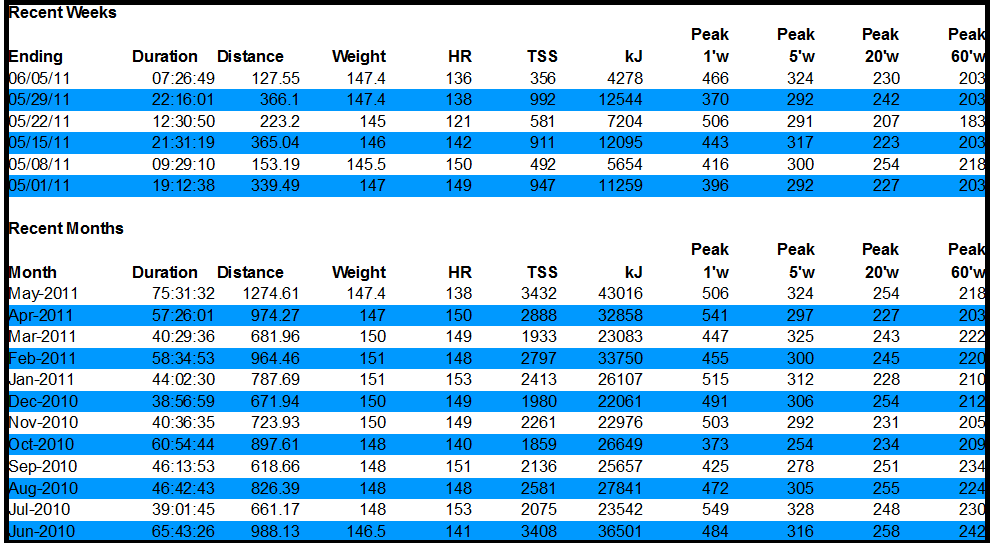
Ending—Dura—–Dist—- Weight— HR— TSS—- kJ——1min—-5’w—-20’w— 60’w 

12/11—–14:24—–237——-155——-143—–516—-7577—-347—–281—206—-179

12/4—— 11:18—–207——-155——159—–529—-7167—-337—–279—-239—–204

11/27——8:39—–151——–155——-157—- 427—-4970—- 466—- 317—-211—-188

11/20——6:14——-99——-155——-154—- 292—-3458—- 468—- 286—-213—-180

This concludes my fourth week of a three-week build and one week recovery period.  This week the focus was on maintaining the fitness gained in weeks one, two and three.  I rode easy this week so that I would achieve full adaptation from week three.   While my hours and mileage were more than last week the intensity was still low.  You will notice a significant portion of my hours was spent in the Endurance Zone (lighter Green).

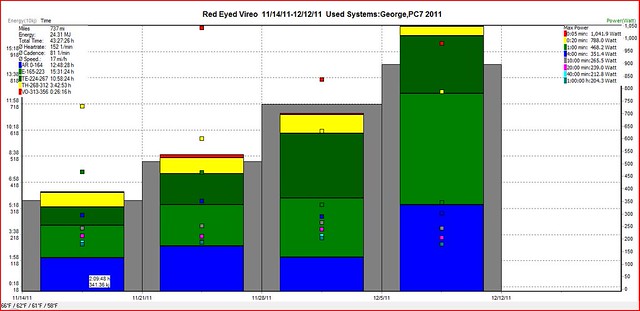
Notice in the graph above how week four has a significant portion of the overall training time in the lower two categories (Blue and lighter Green) My endurance zone is between 165-223 watts.  I feel comfortable riding at that intensity.

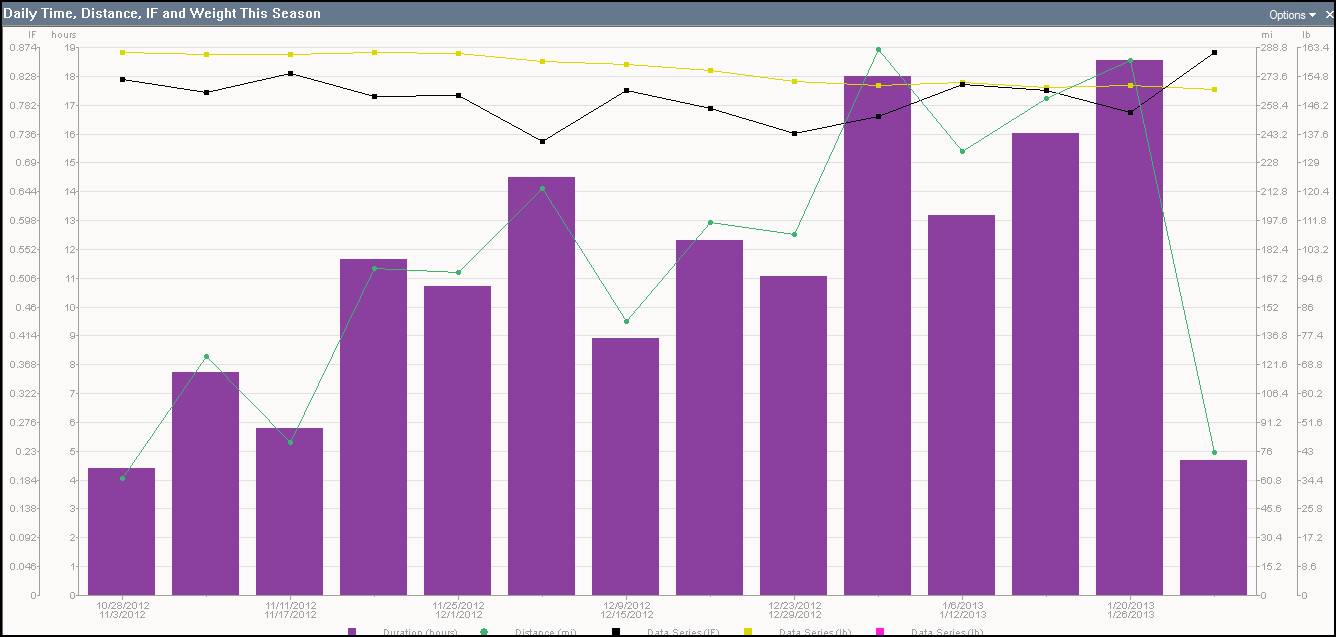
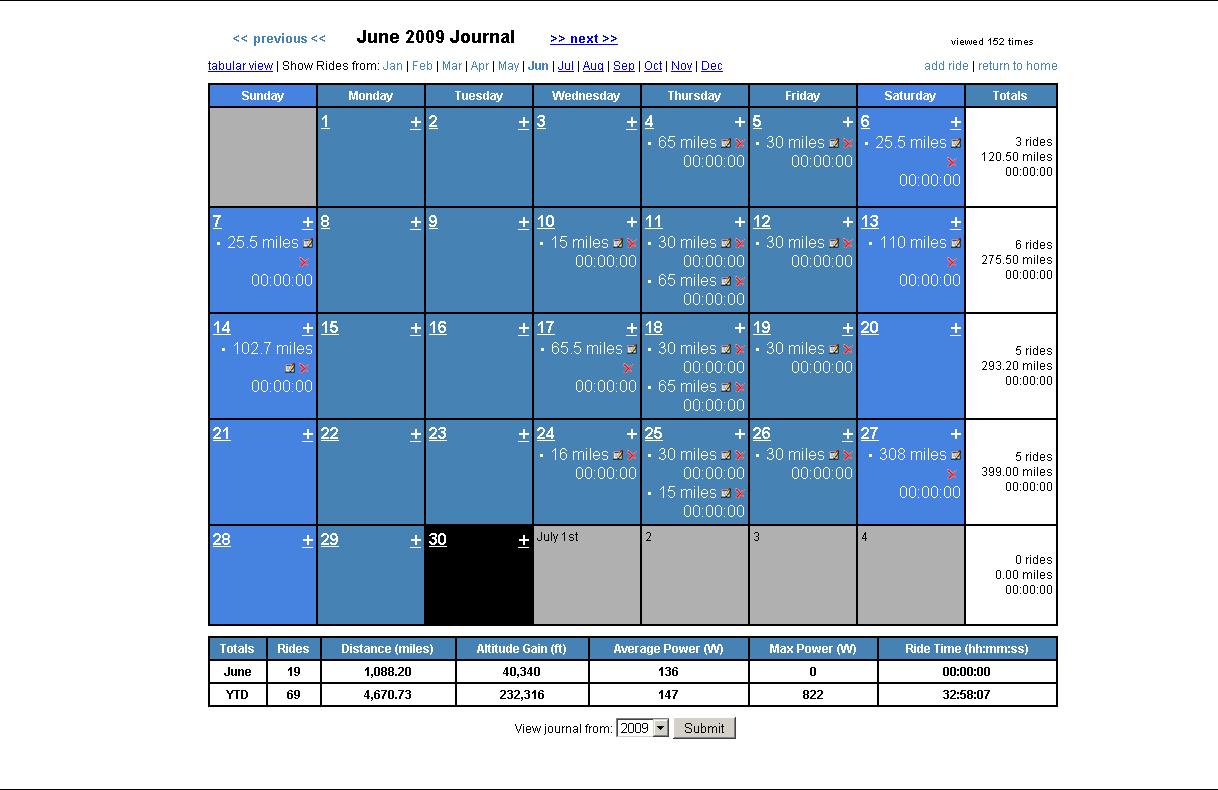
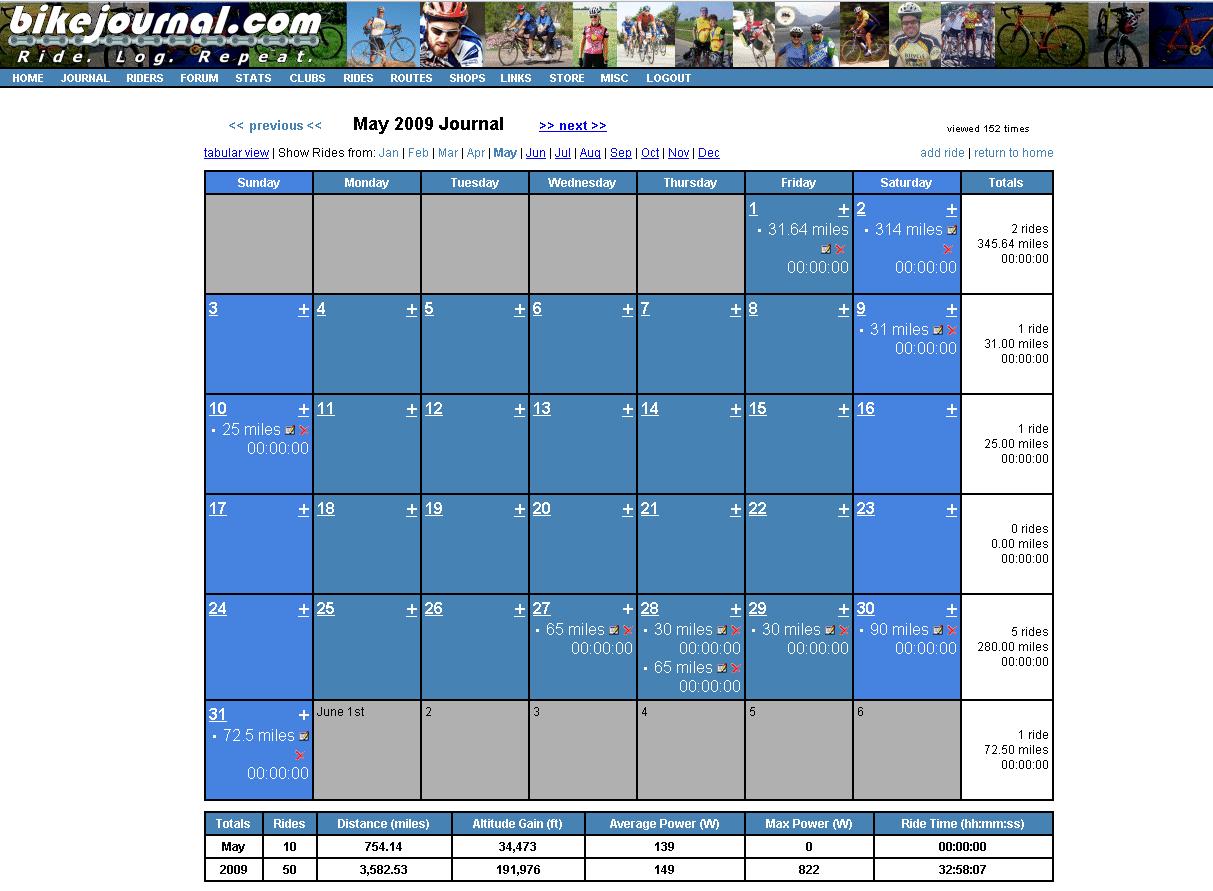
Above is a graph depicting hours ridden with Bars and mileage ridden by the Line.  The increase over the last four weeks has been moderate and consistent.

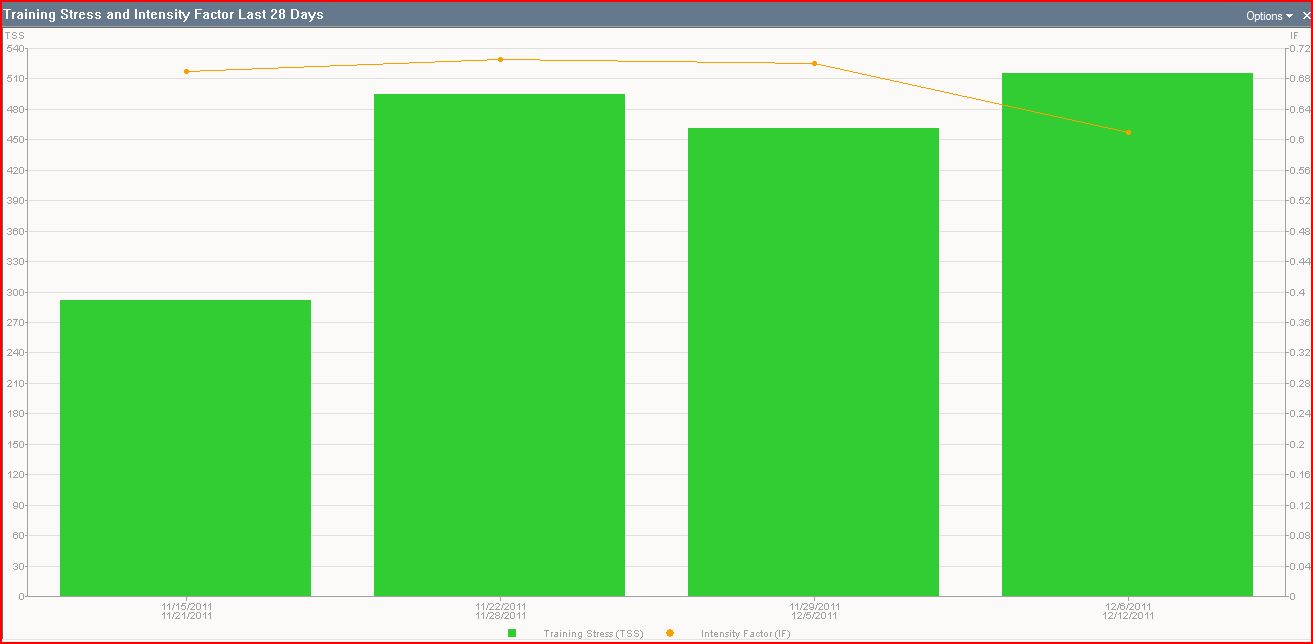
Above you will see how even though I did more mileage on my fourth week my IF (Intensity Factor) is much lower than any of the previous weeks. This type of building takes discipline and training with a purpose. My SRM Power Meter is the best tool for proper pacing.

Nutrition and rest are two very important components of a successful training program.  I use AminoPure after every workout.  It ensures I maintain good health as it boosts my immune system and helps me recover quicker.

I also increase my protein intake to ensure good muscle recovery for the next day’s training effort.  Interphase from Sportquest has 34g of protein with only 190 calories.  If I have been training really hard I make a smoothie before bedtime so I can sleep through the  night.

I rode five straight days with no rest days for a total of 14 hours 24 minutes and 237 miles. A little more than three additional hours and 30 more miles than last week.  Training Stress Score was down from  529 to 516 and kilojoules was up from 7167 to 7577.  Remember the kilojoules is closely related to calories expended.  Notice how on the Performance Management Chart my Acute Training Load (stress over 7 days)  is up from  72.6 to 79.5 and the Chronic Training Load (stress over 42 days) was up from 39.2 to 47.9.  Two items of notable mention:

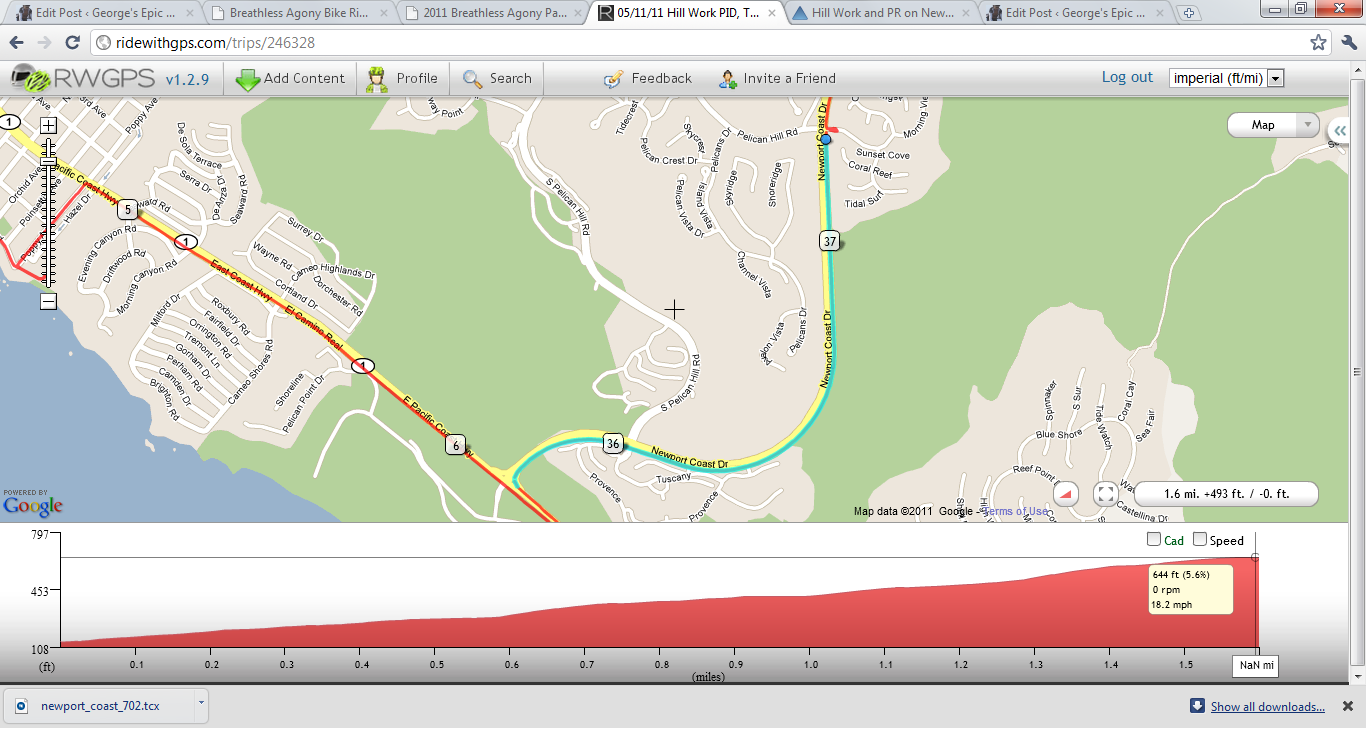
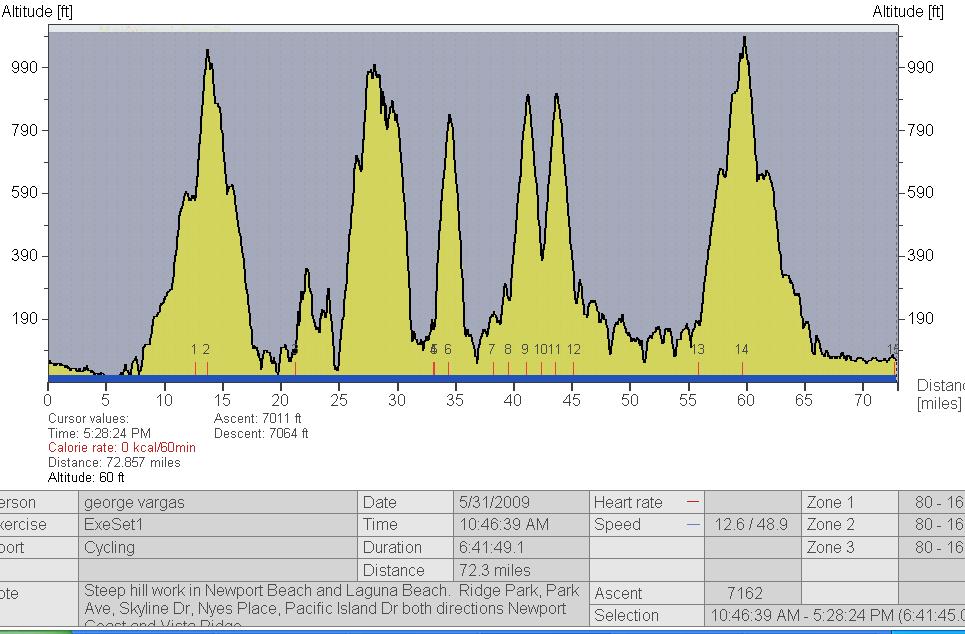
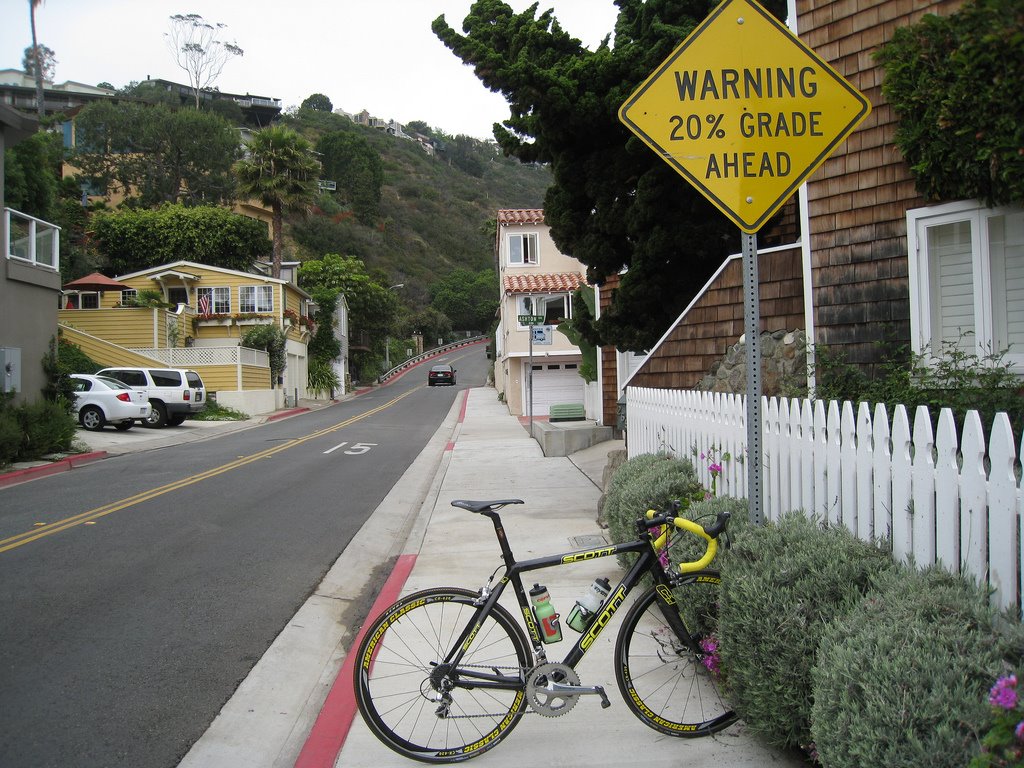
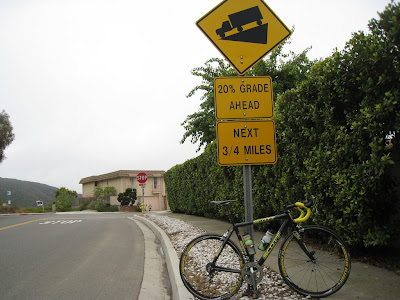
1.  A good 4.5 hour endurance ride in San Diego

2.  Followed by another good 3.5 hour endurance in San Diego

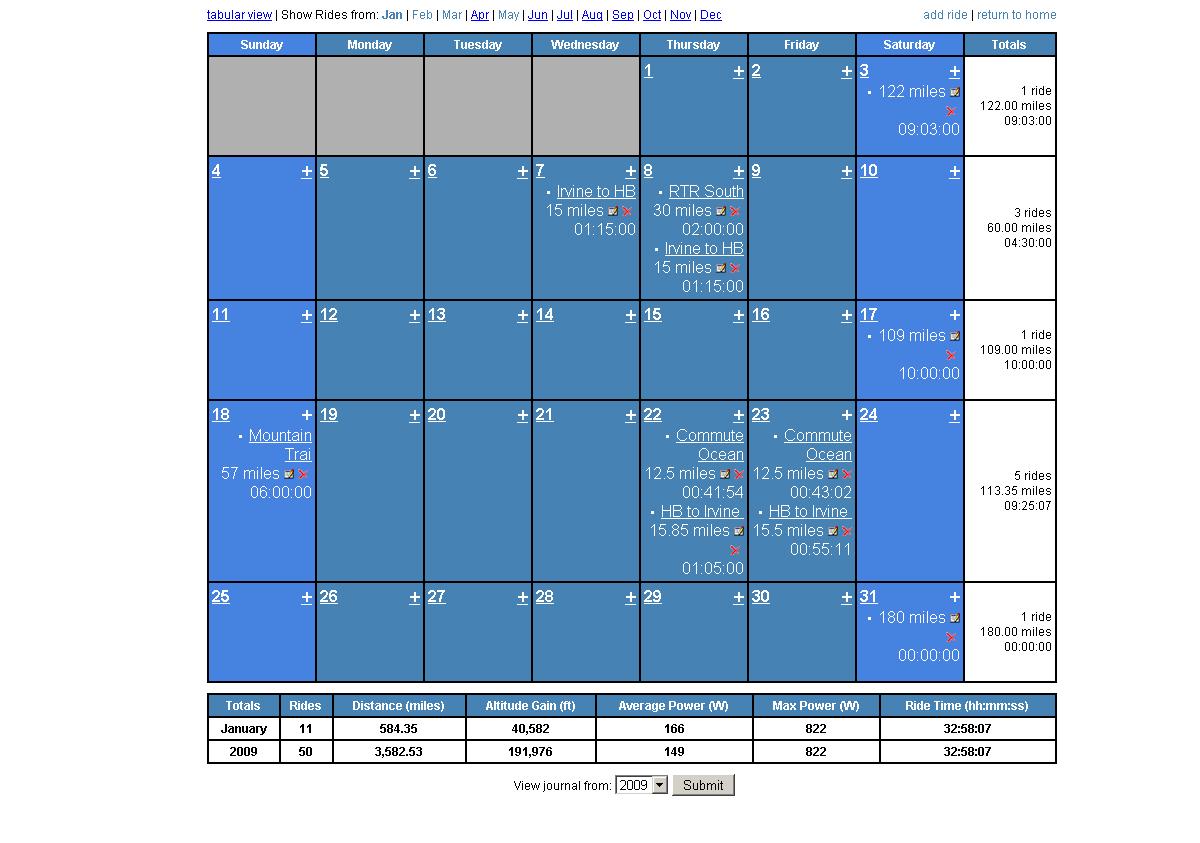
Just for fun how about these statistics for the last four weeks of training:

I rode 737 miles burned 24,000 calories,  43 1/2 hours and averaged just over 17 miles an hour.  

Thank you for reading my blog.  Please pass it to a friend!

Newport Coast Drive PR (6:50 Normalized Power 321 watts 4.8 w/kg) & May Month End


On the last day of a 75 hour, 1274 mile month, I set a new PR on Newport Coast Dr.  My new time of 6:50 is 12 seconds faster than my previous PR from earlier in the month of 7:02 and 31 seconds faster than the PR before that of 7:21.  I held 321 watts for almost seven minutes.  My weight was 147.4 and my 4.8 w/kg was the highest and longest time frame I have ever held for that w/kg.  Keep in mind, the pros hold 6 w/kg for 30 minutes or more once again proving I’m just your average working stiff that enjoys riding a bike.  And speaking of working, that 1274 mile month was done by riding 2-2.5 hours in the morning and 1.5- 2 hours at night after work.  I often see Crow going in the opposite direction. ONCE last month we were going the same direction and chatted a few minutes.  I had a few centuries thrown in as well.  You may not know but I can’t ride on weekends because I am either working or I have my six year-old son.


George “Red-Eyed Vireo” Vargas sets new PR on Newport Coast Dr of 6:50

New Power Profile after PR

Month End numbers for May.

As you can see above, May was my first thousand mile month in a long time. I’m fortunate to have a good base from my first years of Ultras where I would do 12,000 – 15,000 miles a year. Why the big ramp up this month? Well because every May I start my preparation in earnest for the Furnace Creek 508 I now have to put in four months of solid training.  By September, I am doing more speedwork (intensity) so the mileage (duration) is shorter.  I would like to do Everest Challenge just before Furnace Creek 508- just like last year with one week apart. AND there is also Interbike in September so basically September is a wash.  Hence, May through August is when I really need to focus on my 508 training.

Stay tuned for more Furnace Creek 508 specific training….

For those that wonder where I am timing my Newport Coast PR’s here is a graph.  1.55 miles 450 feet of gain about 6ish% grade.

PLEASE PASS MY BLOG OUT TO YOUR FRIENDS.

Month End Report – November 2010


My first full month of training for the 2011 season.  I am participating in the local group rides again.  In the winter months or “off-season”, the local racers decrease the intensity and minimize the attacks on the rides.   Tuesday and Thursday mornings, also known as Coffee Crew,  group rides are the faster rides of the week.  Currently, my schedule conflicts are massages on Tuesday mornings and hill repeats on Thursday mornings.  As the season progresses I will alter my schedule and integrate at least one of the Coffee Crew rides in my weekly plan.  My favorite ride is the Wednesday Ride.  I can add mileage fairly easy by riding more miles before and after the established 45 mile loop.  Here is a comparison of three successive weeks of Wednesday rides where I increased my training load per ride, in case you missed it.

Below you will see screen shots from Training Peaks WKO 3.0 (the best software available for analyzing power data).  All of the data presented below is self-explanatory.  Please contact me if you have any questions and I can make follow-on posts with more detailed explanations.  Keep in mind that a training plan is cumulative and for now the duration and intensity is moderate.  Hey and I also work 60 hours a week 😦

Recap of Four-Day training block


I woke up this morning with stiff and achy legs– but a good ache.  Some of it in part because of the four days of riding.  I also attribute the dead legs to the sprints and 30 second efforts I did at the end of my ride on Saturday.

I’m happy with the numbers I put out over the last four days.  It will take a couple of days to recover fully from my efforts.  I should come back strong and rested by Tuesday.

All for now!

2010 June End of the Month Numbers


Another month comes to a close.  June was a good month with the focus on the 10 Toughest Climbs in California being a main impetus for getting me on the bike.  I can happily report that after two months of dealing with my own personal shit I am back on the bike on a more regular basis.  As you can see by the cumulative data below I have turned up the heat.

1.  65 hours on the bike for the month of June.  The largest amount of hours since February

2.  Largest amount of mileage, 979,  since February

3.  Highest TSS- Training Stress Score–3375,  since February

4.  Highest Kj- Kilojoules,  36,217, since February

From May to June my kj per hour (k/hr) also increased – an indication of a little higher intensity in my training. 538 k/hr to 556 k/hr, respectively . I will continue to increase that number slightly but not until I taper off the mileage and climbing and start riding more group rides will that number significantly go up.

The Performance Management Chart from Training Peaks wko 3.0,  shows a steady upward slope on the BLUE line which depicts the chronic stress I have put on my body over the last 42 days.  Things are progressing nicely.  I have a sore throat today, actually the last three days, but no illness or injuries to report–ONWARD!!!!!

August Month End Numbers


My cycling mileage numbers are less than ever for the month of August as I prepare for Furnace Creek 508. I have been doing more speed work and less volume.

What you see below is the Performance Management Chart from Training Peaks Software.

The pink line is Acute Training Load ATL=Short term effects- workouts done in the last 14 days

the Yellow Line is Training Stress Balance- TSB represents the balance of training stress or how well you have been juggling your training load and your rest periods.

And the Blue line is Chronic Training Load- CTL=Long term effects- workouts done 15 days ago and older

You’ll notice that the Pink lines or my ATL kept increasing with spikes during June and July. You will also note that the TSB was closing the gap as the ATL was less and less. My CTL has been rising ever since May 27th. I will now begin a slow taper as I am just shy of one month from my goal event of the year. I do have one last hard weekend left 2 weeks before the Furnace Creek 508.

I should be fit, rested and fresh by October 3rd.

source

72 Miles with 7200 feet


Tick mark #6 is the top of Nyes Place.

I love it! They give you a warning LOL!

It’s not until the top that you see you have 3/4 of a mile to climb at 20% grade after that 3/4 mile you are still climbing at over 15% with a couple of “flatter spots” to finish the 1.25 mile climb.

I had a good day on the bike. It was the end of my five (5)day training block. Now I rest for two (2) days and get back at it on Wednesday for my commute.

Here are my May month-end numbers.

Totals/ Rides/ Distance/ Altitude Gain (ft)
May/ 10/ 754/ 34,473
2009/ 50/ 3,582/ 191,976

Yes the mileage is down and the elevation gain is way down for the year. I need to bump it up if I’m going to be ready for my September and October main events.

Here are the rest of the months so you can catch up.