Jamis Xenith SL – Test Ride


You know sometimes I love my job.  The Jamis rep came knocking on our door earlier this week.  He wants to open an account with us because he sees our shop as a reputable mid to high-end road shop with a good vibe.  As part of his sales pitch he said he had a demo bike that the staff could ride and evaluate it.  Wouldn’t you know it the demo bike was a size 54cm– lucky me.

Ok so now I have a weekend with the Jamis Xenith SL.  Here is the write-up from their website:

“Pro racing is the toughest test lab in the world. And that’s where Xenith SL and Team really shine, under the pedals of the Jamis/Sutter Home/Colavita pro cycling team, weekend after weekend.

Last year’s Xenith was a high-water mark for performance. This year we kicked it up a whole new level. We used every trick in the book, then added a few pages of our own: like Near Net Molding technology that allows hyper-accurate reproduction of our FEA-optimized layup schedule. With a high impact-resistant resin binder system and Omniad fiber lay-up, plus asymmetric chainstays that balance out drivetrain stresses, and a tapered-steerer fork with 1.5” lower race that’s completely hollow from steerer to dropouts.

The result: a lighter, stiffer, more durable,
faster platform.”

Source

If my weekend goes as planned I will do a short 30 mile ride tomorrow to make sure everything is good to go on the bike.  Then Sunday I’ll do my favorite century — The Palomar Century.  It is 100 miles and 10,000 feet of climbing with the featured climb being Palomar Mountain 11.7 miles 4100 feet of gain for an avg. grade of 6.8%.

Stay tuned for the Vireo Review…


New Shoes for Felicia – Dura-Ace 7850-C24-CL


Front wheel with rim strip

Rear wheel with rim strip

I just received a new set of Shimano Dura-Ace wheels WH-7850-C24-CL Carbon Clincher wheels. Features from the Shimano website:

  • Pro-Tour performance with the convenience of clinchers
  • Patent pending Shimano carbon-alloy composite construction
  • Aerodynamic 24mm profile rims
  • New titanium freehub body w/quick engagement
  • New wider flange hubs and offset rear rim for increased rigidity and power transmission
  • Shimano quality proven angular contact bearings with oversize 7075 alloy axles
  • Weight: 1386g (pair)

source

I will be evaluating them over a few rides.  These wheels are part of the make-over for Felicia my 2010 Felt F2 with Di2.

The Wednesday Endurance Ride with Mike


Endurance ride today with just a few surges here and there.  Just as we were beginning our pace-line someone flatted and we actually stopped to regroup. I thought that was really cool.

I’ve included a Training Zone Chart from Training Peaks WKO 3.0  What is interesting is even though I thought this was an endurance training ride I spent 58% of my time in the Active Recovery Power Zone of 0-153 watts.  It is a group ride so a lot of energy is conserved while drafting.  I will experiment by riding at the front next Wednesday to see the difference in power zone distribution.

End of the Month Numbers for May 2010


Above is a modified screen shot from Training Peaks WKO 3.0.  The software compiles your data and has many different charts and analysis you can use to dial in your training.  I will only discuss two simple charts that I find essential in tracking my training stress and recovery.

Let’s begin with the chart above.  It displays the amount of hours and mileage trained in the “Recent Weeks” and then the weekly data is compiled for the “Recent Months”.  When training there are two very basic variables — Duration and Intensity.  Looking at the data above Duration is quite easy to pick out since it is labeled.  Intensity however is a little trickier to discern from the data provided.

Let’s look at several ways to determine the intensity from the data provided.  One way to gauge intensity is to look at the Training Stress Score (TSS).  Your TSS will tell you how hard and how close you were working in relation to your Functional Threshold Power (FTP).  A TSS score of 100 means you were working at 100% of your FTP for one hour.  So when seeing your duration compared to your TSS you can make some assumptions to your training load and your intensity.

Another way to loosely determine your intensity would be to look at your Heart Rate average for the week.  The higher the number the higher the intensity  – simple.  Another way would be comparing the number of hours to the number of kjs.  For example, Week ending 5/30 had fewer hours (18:38) vs week ending 5/16 (19:03) but 5/30 had more kjs than 5/16 10,551 and 9810 respectively.  And lastly, you can look at the 1 minute, 5 minute, 20 minute and 60 min peak power numbers.  You will note that the week 5/30 has the highest peak power numbers for the previous 5 weeks.

The same analysis can be used on the “Recent Months” total provided below.  Incidently, you may notice that 609 watts is the highest recorded  1 minute peak power.  It is a personal record and I have charts and a little write-up here.  The rest of the data indicates the month of May was a solid month.  The totals for the month of May were 53 hours, with 810 miles (everyone understands miles) Avg Heart Rate 154 bpm with a fairly high 2886 TSS for the month (as compared to the most recent months).

Now let’s look at the chart below.  It is the Performance Management Chart for the month of May.

BLUE– the chronic fatigue on your body (last 42 days)

YELLOW– the amount of rest/recovery

PINK — the training stress on your body over the last 7 days.

You will note beginning with May 1st, I have been increasing the amount of training stress and the rides have been getting harder and harder yielding higher Training Stress Scores. Pink line displays higher peaks, the yellow displays lower drops and the Blue line steadily goes up.  All good indicators as I build up the duration and intensity of my training.

Dana Point out and back with Justin


Entire workout with a stop in Dana Point (grey area)

Southbound to Dana Point with Justin Northbound leg was solo

I had a good hard and fast ride with Justin to Dana Point.  On the return leg I was alone and worked the rollers and maintained a good hard tempo.  I tried to stay above 500 watts on the rollers as I stood up and powered over them.  It worked sometimes and sometimes not so much.

You can see from the data above the time was less for my return leg but the Normalized Power was only 3 watts different.  But notice how the HR:PW % is only 5ish on the return leg.  That means I kept my power and heart rate in a close range to each other for the whole leg back to Newport Beach.  Normalized Power of 244 (3.6 w/kg) for one hour is good for me.  I’m happy with today’s training.

Easy Spin Today


My legs ache today.  I went for a quick ride after work.  I needed to ride to help the recovery process. My goal was to spin as much as possible and put out only the effort required to crest the rollers. I rode for 1.5 hours with nothing noteworthy to report.

Thanks for reading my blog.  Pass my blog to a good friend of yours.

Palomar Mountain Century- 100/10K


Today I went to Palomar Mountain.  I began and ended my ride in Encinitas.  This used to be my weekly long training ride when I lived there.  The stats are simple 100 miles with 10,000 feet of climbing.  It’s the perfect century in my opinion.  It has rolling terrain, some flats (not much), lots of climbing and descending.   Along the way you ride through the micro-climates that make San Diego weather so famous.  First you start in cool coastal weather, then you experience the heat of the inland area and of course the mountain climate as you crest Palomar Mountain at 5250 feet of elevation.  Lastly, you fight a headwind all the way home from Palomar.  You are heading in a general westerly direction the entire leg home. I’ve always loved this ride but living in Orange County I don’t get a chance to do it often. Actually, I can’t remember the last time I climbed Palomar Mountain.
I rode at a good pace for the majority of the ride.  And then I got to Palomar.  My gearing choice was too tall and I struggled through the orange groves where the steepest pitches of the Palomar climb lie.  I rode the 11-23 cassette that I have been riding throughout the year in races and training and it was a little tough.  Who knows if it had anything to do with cumulative fatigue from yesterday’s 3+ hour climb to Dawson Saddle. I should return to Palomar with an 11-25 cassette next time. I think the two extra teeth will make a big difference.  I’m a stronger rider now than I was a few years ago but the big difference is I’m lighter.  My weight loss has made a big difference in my riding in particular my climbing.  I try to maintain my weight under 150lbs.  By comparison, when I started Ultras I was 170lbs.  Sadly, I was actually 185lbs at my portliest.
Above is the data for the Lake Wholford climb.  It was featured on the Palomar Mountain stage of the Tour of California last year.  It is a two mile climb that has a steep first mile.  After that it is about 7% for the second mile.  If you are going out there to time yourself I start my timer as soon as I make the turn onto the road and stop my timer at the paintball park entrance.
And now for some techno-babble Shimano Dura-Ace makes an 11-27 cassette for their new 7900 series. I know I will need that ratio on Towne Pass when I do the Furnace Creek 508 in October.  What I would really like to use is an 11-28 cassette.  When I buy my SRM I will buy a standard 53/39 crankset and it would be nice to have the 28T since I won’t be able to afford a compact SRM AND a  standard SRM.  But alas, the rear derailleur for the electronic Dura-Ace aka, Di2, that came equipped on Felicia does not accommodate an 11-28 which would be really sweet on Towne Pass.  I guess I just have to get stronger eh?
I had a front flat on the lower slopes of Palomar. It took over five minutes to change the flat because I couldn’t find what caused it.  I took my time inspecting the tire and tube before installing the new one.
My legs started to fade on the upper slopes and I slowed down considerably.  My total time on the climb was 1:27:58.  I’m going to have to work on that.  I start my timer at “the store” and stop it at the intersection of East Grade Rd and South Grade Rd.   Part of the reason I faded was the 11-23 cassette on the lower slopes and some of the work I did earlier on the foothills leading up to Palomar. One interesting thing is I only saw one other cyclist on Palomar all day and guess what?  It was Mark Ely, a client and friend that I have sold things to throughout my years at Nytro — notably a bike, a Cervelo R3.
Two things threw me off on today’s climb.   The first one was the elevation signs for the 2,000 and 3,000 feet were missing.  I don’t know why they would remove them but they weren’t there.  I had a general idea where they should have been but I wanted to mark my lap times at each thousand feet.  The 4,000 and 5,000 feet signs were still in place.  I thought  it was odd that not all the elevation signs were  in place.  The second thing that threw me off was I had forgotten the mile marker for the top.  I was counting down the miles but I wasn’t sure where the top was anymore.  My miscalculation on the last 1.5 miles messed with my mind a bit.
I was hungry when I crested so I ordered a fried egg sandwich from Mother’s.  I thought it was a simple enough sandwich to make and it shouldn’t be long.  What I didn’t know is that even though the restaurant was empty there was an order for five club sandwiches ahead of me.  It took 15 minutes to get my sandwich .  My stop at the top of Palomar was 20 minutes which WAY TOO LONG.    I usually crest and IMMEDIATELY descend.  But today I had to have lunch.  Back to back hard climbing days are hard to stay fueled for on the bike.
The ride back from  Palomar was uneventful.  I felt strong fighting the headwind all the way to the coast.  The rollers in Rancho Santa Fe were fun too.  I ended my ride at Nytro.  My recovery meal was a grilled chicken pesto sandwich pannini– yummy.  I ate my sandwich while I visited with my former coworkers.

Dawson Saddle in the Freezing Rain


My ride today was cut short because of really bad weather.  But I accomplished my first goal which was to climb to Dawson Saddle from Duarte.  The climb is an 8,000 foot gain in 35 miles.  The good news is all my times were better and my power numbers had improved from two weeks ago.  The bad news is I had intended on more climbing today.

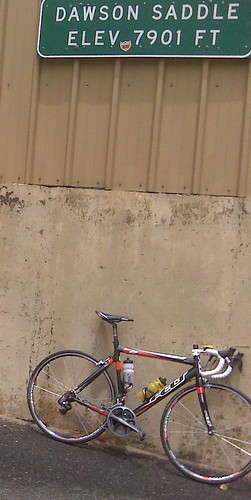
When I arrived at Encanto Park in Duarte it was overcast but the temperature was in the high 60’s.  I looked off to the mountains and saw clouds but didn’t think too much of them. However, the higher I climbed in elevation the weather got worse and worse.  At lower elevations it was a light drizzle and chilly.  By the time I crested Dawson Saddle, 7901 elevation, it was pouring freezing  rain and the temperature was in the 30’s.  My hands were so cold it took me nine minutes just to put on knee warmers and a vest!

I was miserable I was shivering and I struggled to keep the bike steady while descending at below 20 mph on Angeles Crest Hwy. I was going much slower on Hwy 39 (10 mph).  Visibility was less than 20 feet — no exaggeration.  The Caltrans trucks would dart to the other side of the road when they realized a cyclist – me – was coming towards them.  I’m sure they thought I was crazy being up there.  The crews I passed had full-on winter gear and they were huddled around the big Cat units enjoying the heat being displaced by  their massive engines.

“Get down from elevation it WILL get warmer ”  I kept repeating those words over and over and over as a means of motivation to keep me moving.  I hadn’t been this cold since the San Diego 300km Brevet where half the field DNF’d because of rain and freezing temperatures.  I was wearing a base layer, two jerseys, a vest with wind stopper, arm warmers, knee warmers, booties over my shoes, gloves and I was still freezing.  I was soaked to the bone and had lost dexterity of my fingers.  I couldn’t open wrappers of my bars or gels and resigned myself to eat hardy once I got down off the mountain.  I tried to pull my bottle out of the cage and couldn’t squeeze my fingers together.  The only thing I was capable of doing was maintaining steady pressure on the brakes.

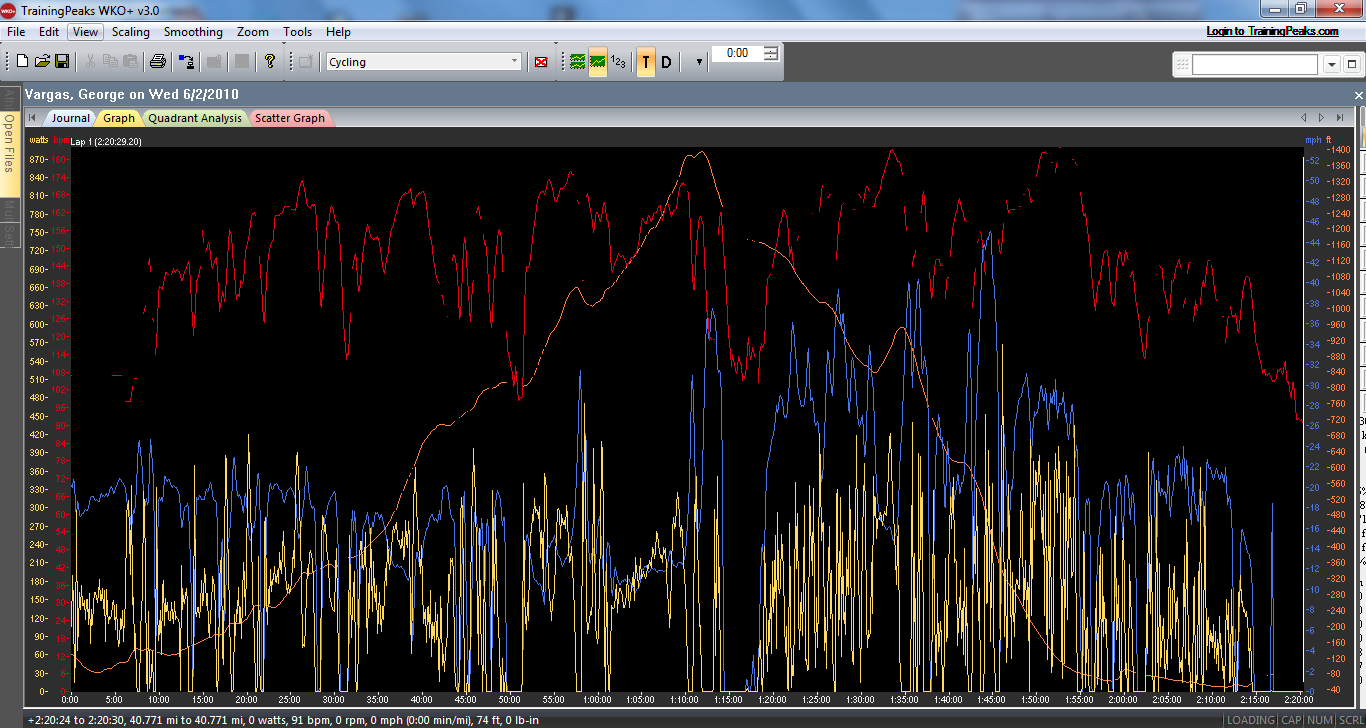
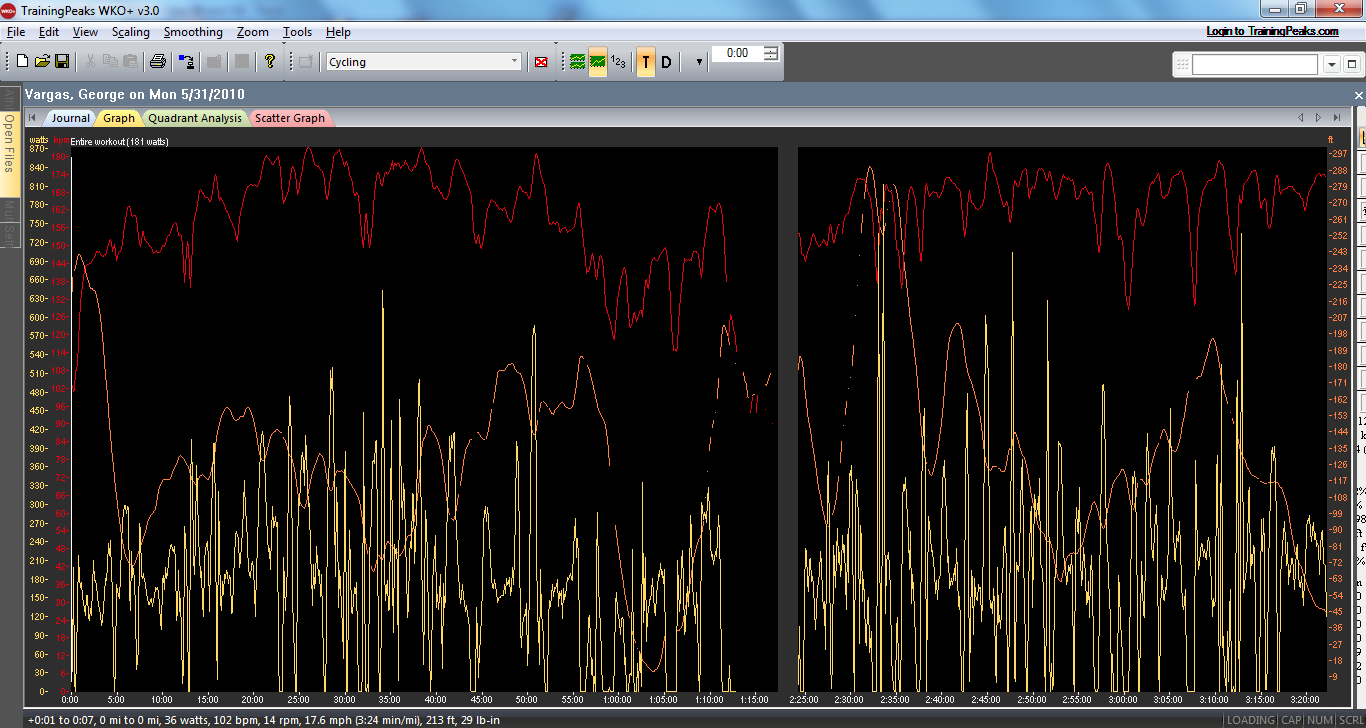
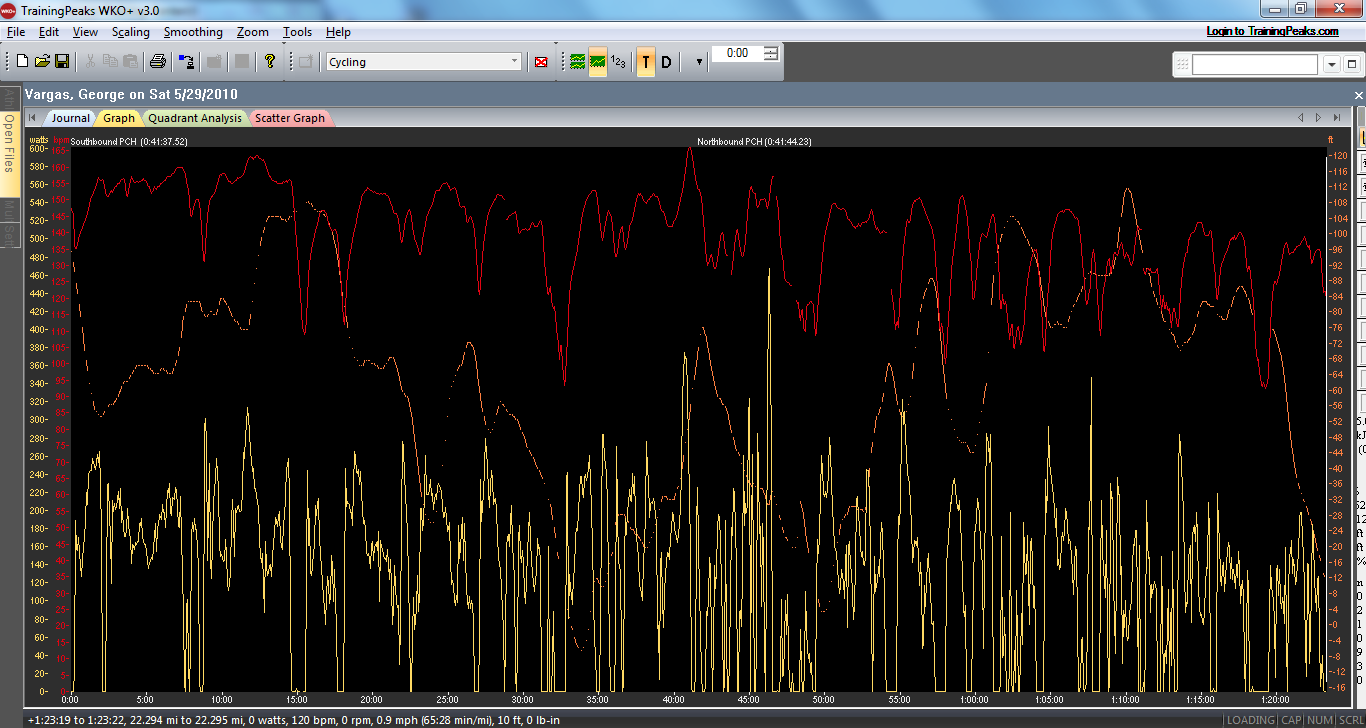
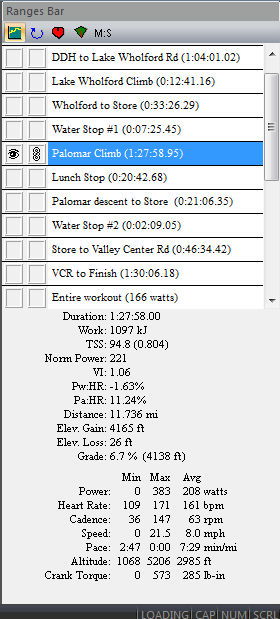
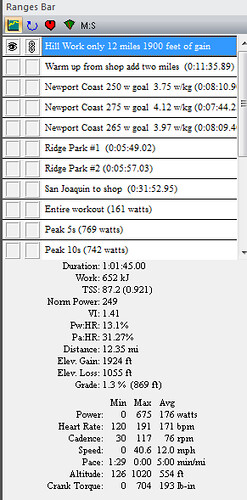
Alright enough about my tales of woe.  Let’s look at the positive outcome of this ride. Below is the power chart from two weeks ago 5/13/10.  You should be able to notice that my  power (yellow squiggly line) trails off significantly later in the climb.  When just looking at time it took me 3:38 to climb from Duarte to Dawson saddle.  Today that same climb in terrible weather took me 3:20 which includes 11 minutes off the bike for a flat.   As I mentioned before I didn’t have dexterity so changing a flat was a long painstaking process.  Most of that 11 minutes was spent trying to warm up my hands.  I stuffed them down my shorts — yeah I know TMI but you gotta do what you gotta do right?

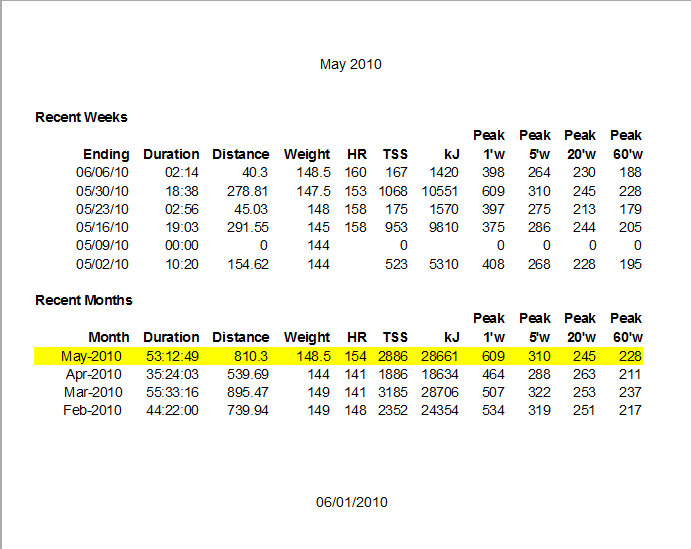
Another absolute measurement like time is average speed.   Two weeks ago my averages speed was 9.7 mph today it was 10.7 mph. I think I will set a goal of 3 hours flat from Duarte to Dawson Saddle.  Doing some rough calculations I would have to increase my average speed for the climb to 11.7 mph to complete the climb in three hours.

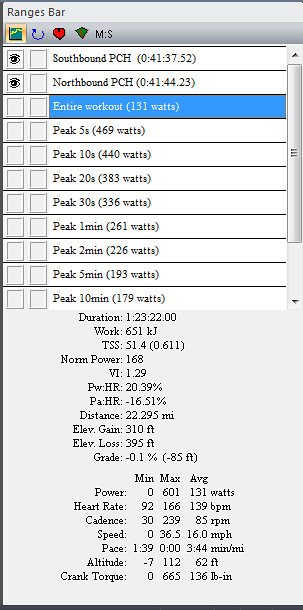
Power Chart from May 13, 2010

Data from May 13, 2010

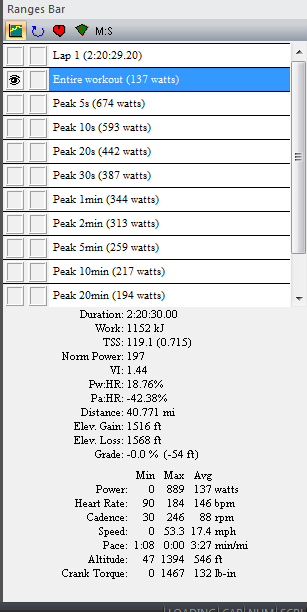
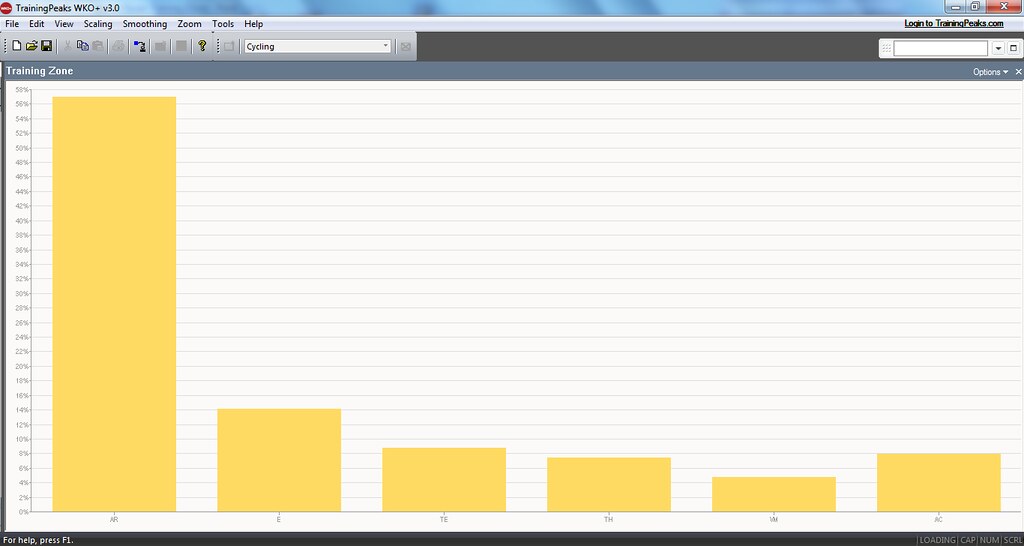
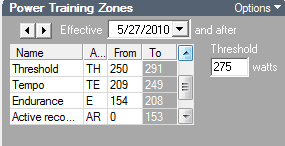
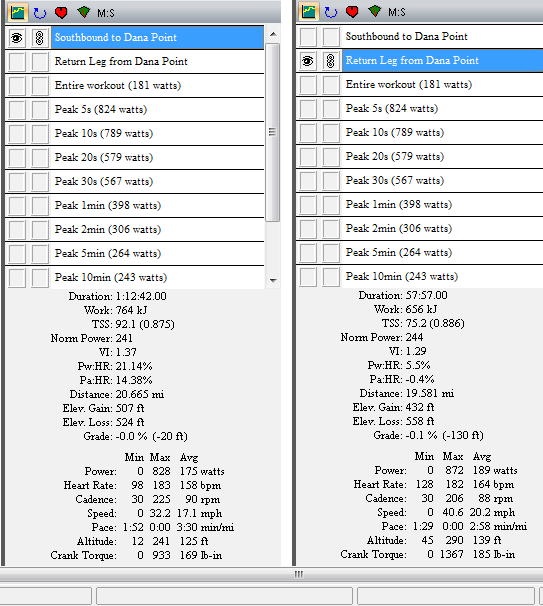
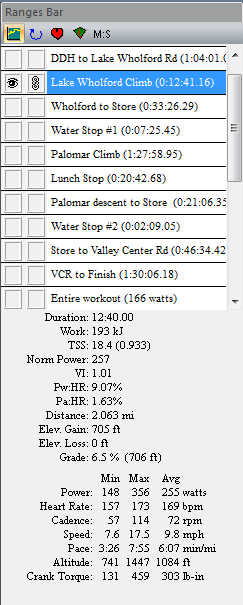
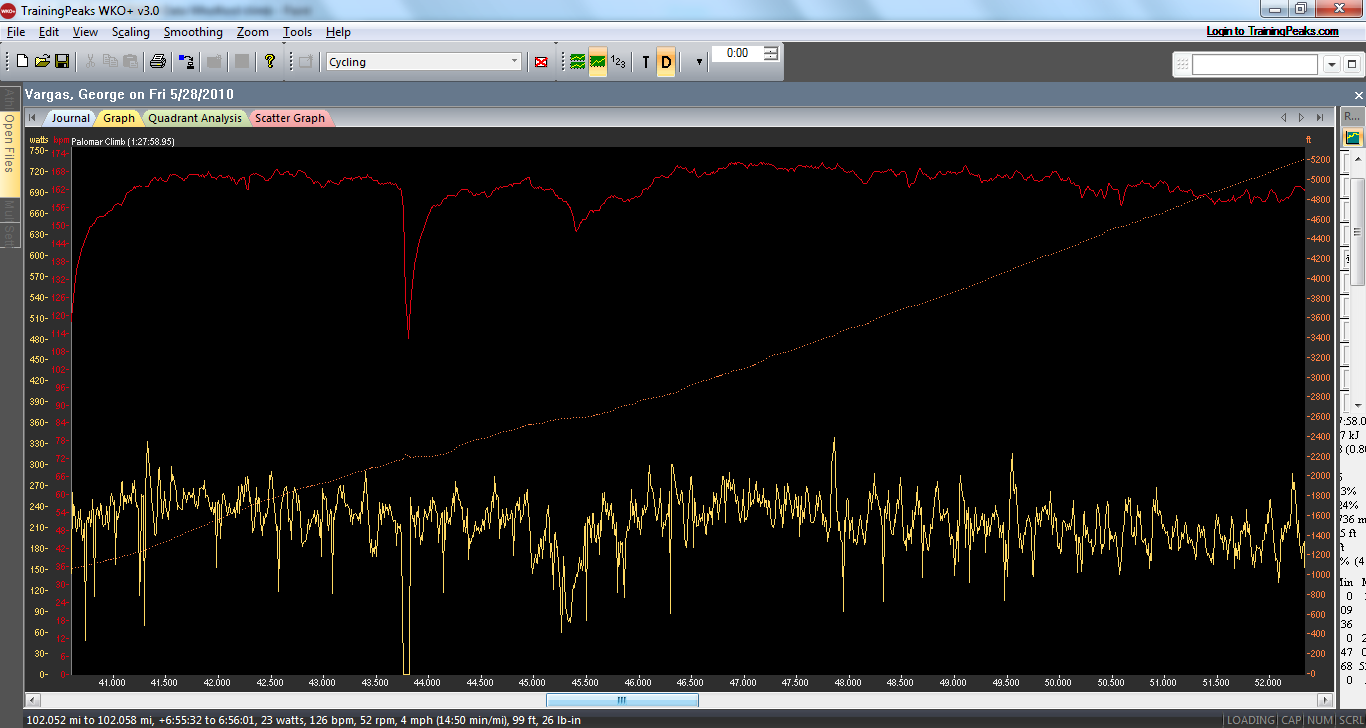
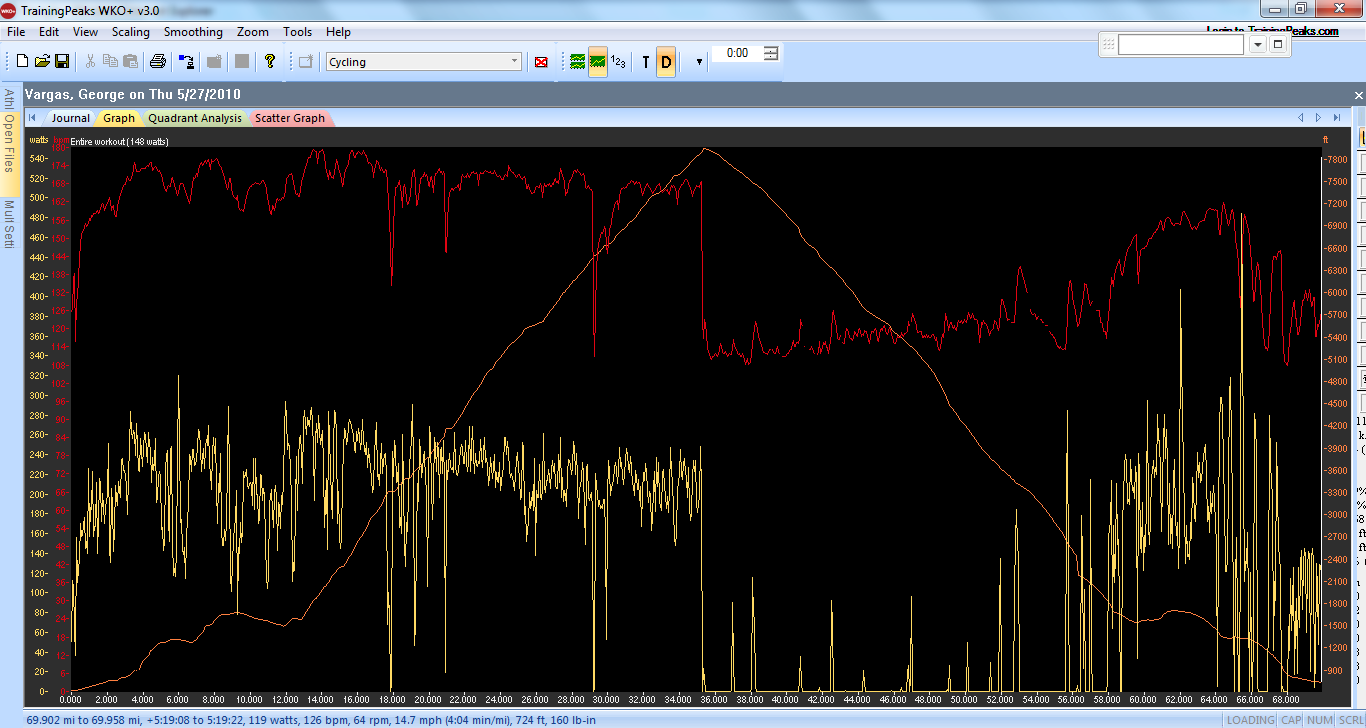
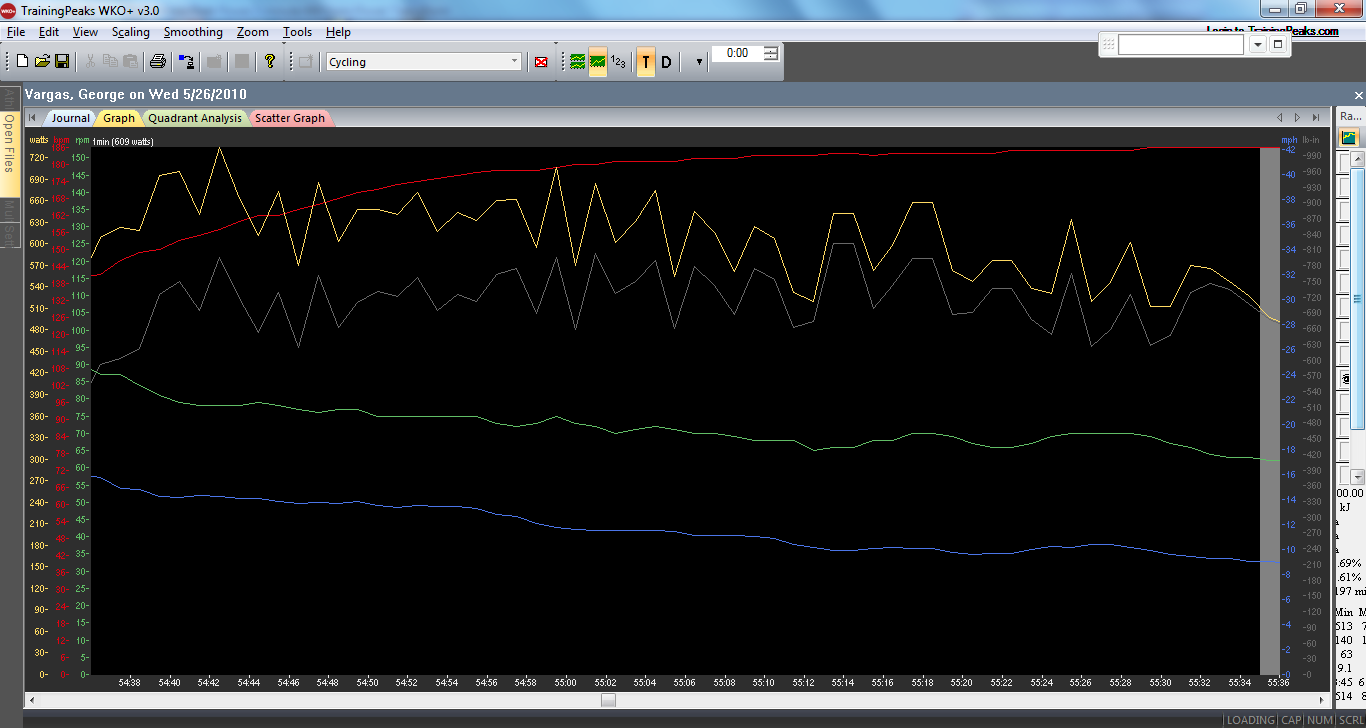
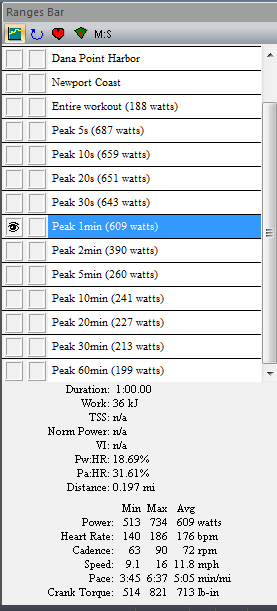
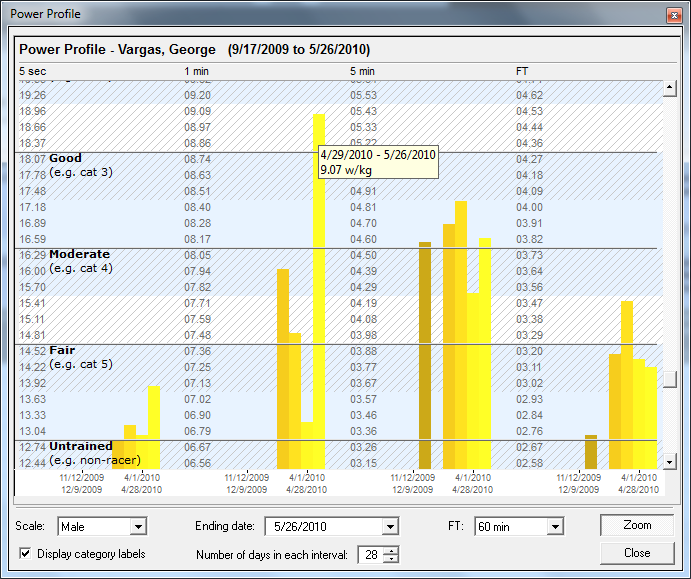
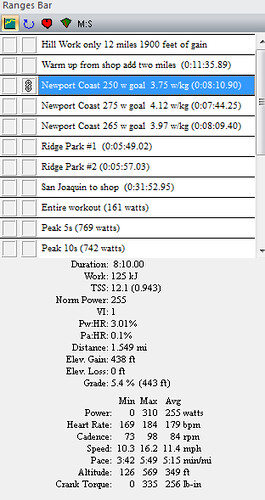
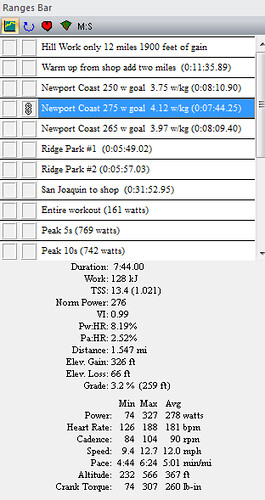
Now let’s look at today’s data.  My power doesn’t trail off as bad on the latter stages of the climb.  Don’t forget this is A THREE HOUR CLIMB.  Let’s put it in perspective — what most people call a training ride of 30-35 miles I’m doing that whole distance going up a mountain.  Also look at my Normalized Power it increased from 191 watts  to 220 watts (3.27 w/kg). It is the end of May and my goal event is in October.  I still have about three solid months to get my mileage and climbing up to race quality.

I was teased by one of my blog readers because I have been climbing with a 53/39 standard crankset and an 11-23 cassette.  Well the truth is, it is difficult for me to climb in those gears too 😉  But here’s the thing, when I started riding with the road-racer type guys most of them have close ratio cassettes.  It was very hard to keep up with them on climbs because they would be hammering in an 11-23 cassette.  Or when on the flats and slight downhills they had that 11T cog and I was in a 12T cog just barely hanging on at 36 mph.  So I switched to an 11-23 and I have been racing on one all year.

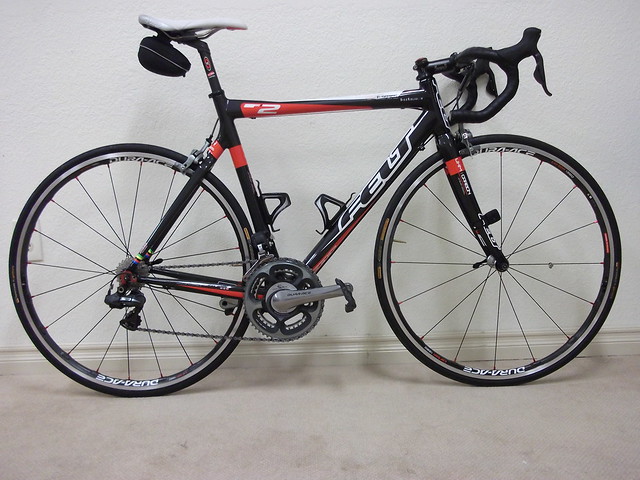
Today’s improvement in data was due in part to riding a different gear set up.  Two weeks ago I rode my Cervelo R3 SL – Rebecca, which is my dedicated climbing bike.  She is equipped with a Compact 50/34 crankset.  Today I rode Felicia which has a standard 53/39 crankset.  I felt myself working harder and at times noticed my cadence dropping significantly.  I remained focused on increasing my cadence which in-turn  produced higher power and consequently faster times up the mountain.  You can see in the difference of the lap times that today was faster in just about every lap.

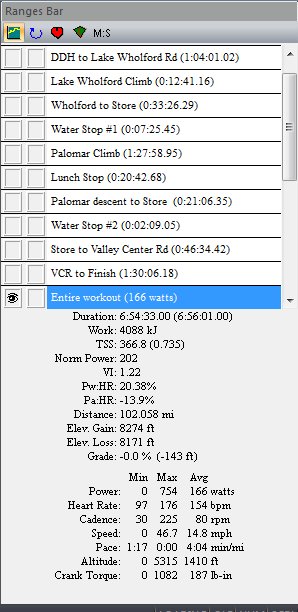
Tomorrow I will be climbing Palomar Mountain.  I haven’t been out there in a long time.  I don’t have data to go from since my hard drive crashed with about three years of power data on it.  Oh well I guess I will just have to set the bar tomorrow.

Dana Point out and back with new 1 minute Peak Power


Two hour training ride today from the shop to Dana Point.  38 miles round trip with about 1,200 feet of gain.  I tried to maintain a good tempo with hard efforts mixed in.  My Normalized Power for the 2 hour ride was 248 watts (3.69 w/kg).  While in Dana Point I attempted and accomplished besting my 1 minute peak power number.  It was 534 now it is 609 watts (9.07 w/kg).

Here is the Garmin download.

I am really happy with my 1 minute peak power number of 609 watts it’s almost half-way into the Cat 2 range.  The hill I performed this 1 minute number was really steep (about 10%) which helped me keep high power.  Now I would like to try a one minute test on a shallow hill of maybe 6% grade.

Hill Workout – Newport Coast Ridge Park


Hill workout today was three repeats on Newport Coast Dr and two repeats on Ridge Park.  My repeats on Newport Coast were done with 250 watts, 275 watts and 265 watts as goals for average watts.  My actuals were 255W @ 3.75 w/kg, 278 @ 4.12 w/kg, and 266 W @ 3.97 w/kg.  My 275 watt repeat was painful and I didn’t think I could maintain that average for the length of the climb (1.5 miles avg 6%).  My Ridge Park repeats were just steady seated climbs with sprints near the top- no specific wattage was targeted.