
Follow me on Facebook
Follow me on Twitter
Follow me on Strava
Follow me on SPOT
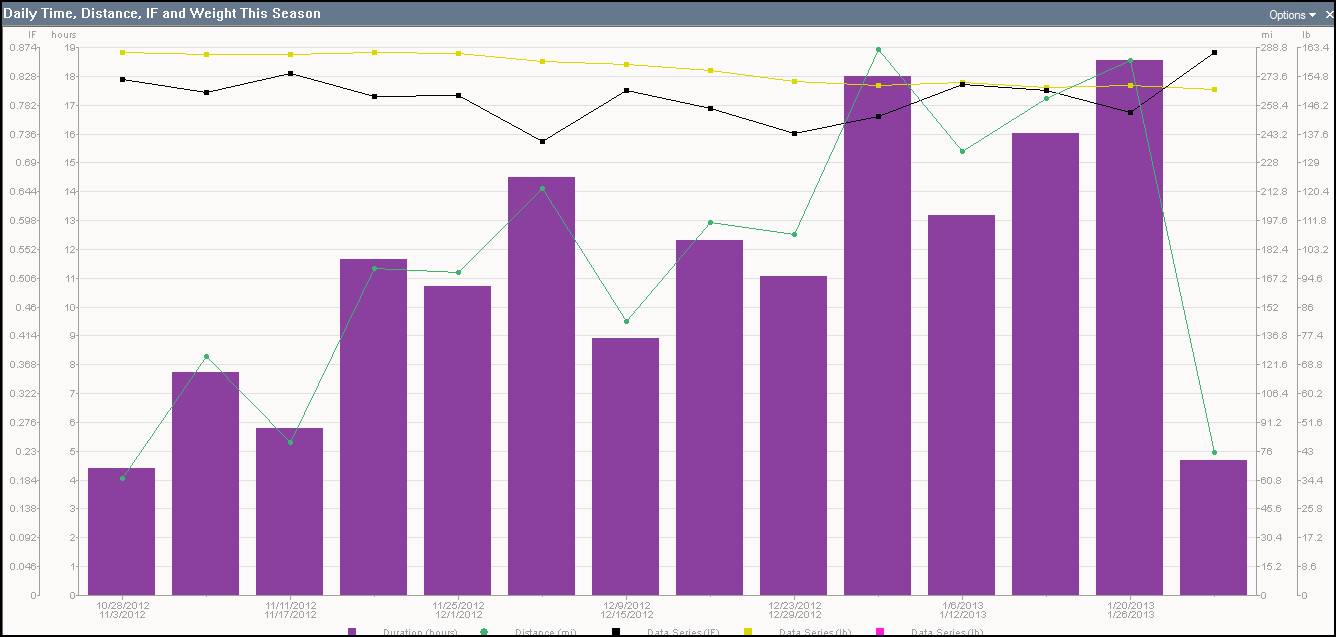
Here are some graphs of my training over the last three months. These are the highlights. All data collected on Training Peaks WKO+ v3.0
1. I hit 1000 miles for the month of January. First time over 1K since May of last year
2. Notice the steady increase of miles and hours trained per month beginning in November 539 miles/35:24, December 896 miles/56:45 and finally January 1002 miles/61:10
3. Notice weight loss from 163 lbs down to 149.8 post ride today 2/1/13
4. I train by hours but miles is easier for most people to understand and grasp so I am using mileage charts. There is quite a bit of power data I can discuss as well.
5. Notice 5 min peak power was 324 watts Normalized Power of 343 watts or 5 watts per kilo today. Even with the weight loss this is the highest 5 minute peak power in the last 12 months! It confirms that I have not lost power or muscle mass during the weight loss.
6. The last week of January was a recovery week and you can see the Acute Training Load line (PINK) and the Training Stress Balance Line (YELLOW) are just about to meet. This translates to a feeling of being fit and well recovered. Now it’s time to build for another three weeks.
If you have any questions please make a comment on the blog and I will get back to you!


Glad to see your training is going well. You’re a different guy now then at Death Valley Fall Double! Hope to see you this weekend.